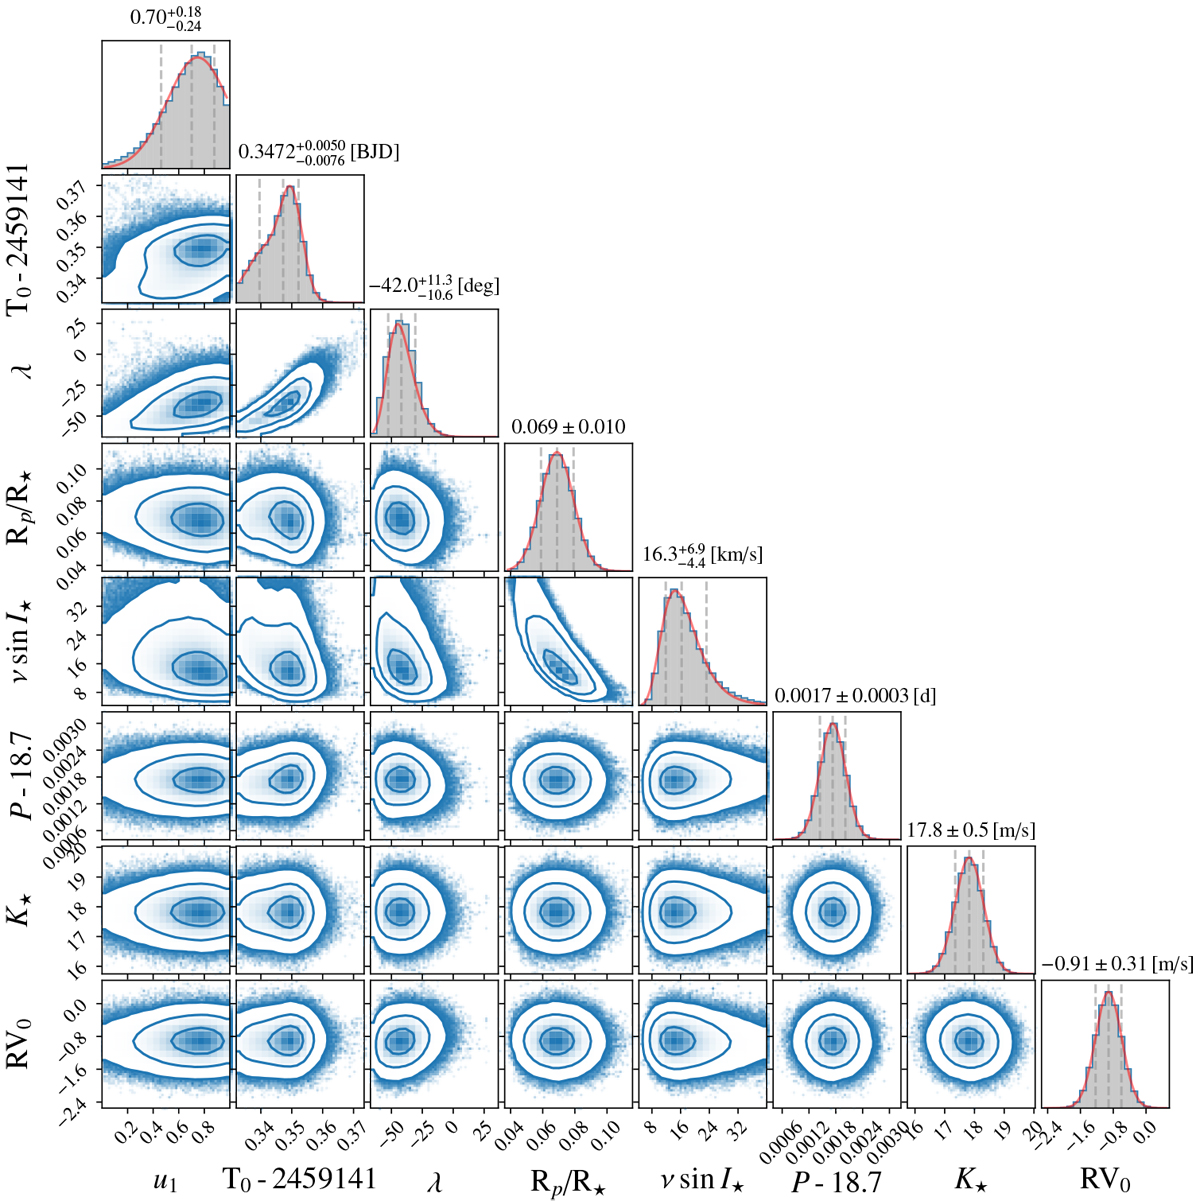
Fig. 7
Download original image
Posterior distributions for the fitted parameters of the RV+RM model. The results are for data where the last 4 data points of CARMENES 18–10 observations have been masked. The median values are quoted as solutions, with the 16th and 84th quartiles given as uncertainties at the top of each column, which are represented as vertical grey dashed lines. All posteriors are modelled well with a Gaussian function with the exception of the mid-transit time, where a double-degenerate solution is derived, as well as λ and ν sin I⋆, where slightly skewed normal distributions are used. In the parameter-parameter plots, 1, 2 and 3σ levels are presented as solid blue lines.
Current usage metrics show cumulative count of Article Views (full-text article views including HTML views, PDF and ePub downloads, according to the available data) and Abstracts Views on Vision4Press platform.
Data correspond to usage on the plateform after 2015. The current usage metrics is available 48-96 hours after online publication and is updated daily on week days.
Initial download of the metrics may take a while.