Fig. 5
Download original image
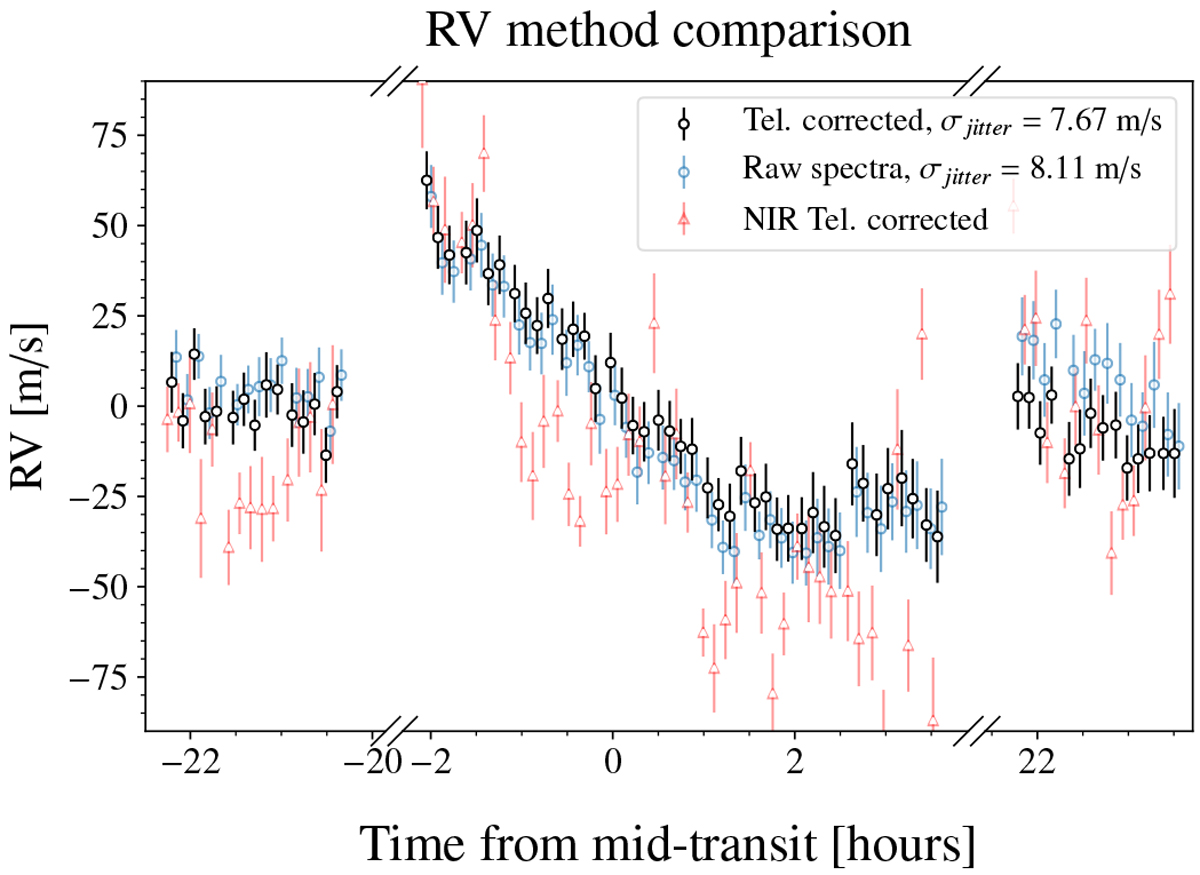
HD 332231 RVs measured during the exoplanet transit, as well as pre- and post-transit epochs. The two VIS sets of measurements are made for the raw pipeline-corrected spectra (blue) and telluric-corrected spectra (black). The raw spectra havebeen shifted along the time axis for clarity. Additionally, the RVs measured from the NIR channel data have also been plotted in the background as red triangles, which have also been shifted along the time axis in the opposite direction.
Current usage metrics show cumulative count of Article Views (full-text article views including HTML views, PDF and ePub downloads, according to the available data) and Abstracts Views on Vision4Press platform.
Data correspond to usage on the plateform after 2015. The current usage metrics is available 48-96 hours after online publication and is updated daily on week days.
Initial download of the metrics may take a while.