Fig. 3
Download original image
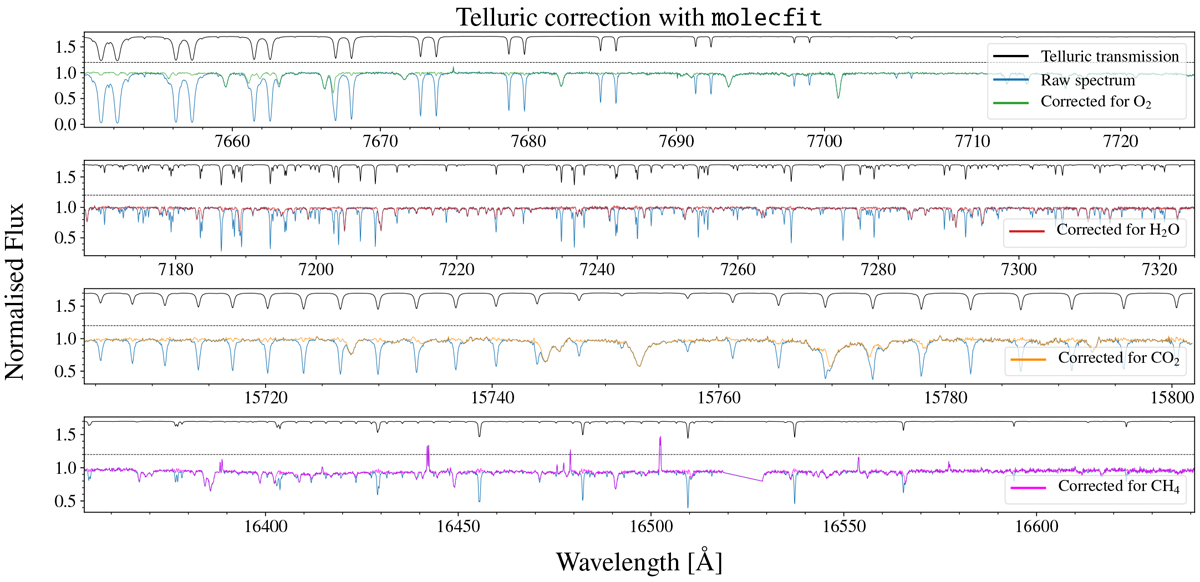
Process of telluric absorption correction of the CARMENES spectra using molecfit. The panels show zooms into regions where the main absorbers are, those being O2, H2O, CO2 and CH4, from top to bottom respectively. The modelled telluric transmission spectrum is presented as a solid black line, shifted vertically for clarity, where the zero flux level is indicated with the dashed line. In the bottom panel some sky emission lines are clearly visible, which are masked at the analysis stage.
Current usage metrics show cumulative count of Article Views (full-text article views including HTML views, PDF and ePub downloads, according to the available data) and Abstracts Views on Vision4Press platform.
Data correspond to usage on the plateform after 2015. The current usage metrics is available 48-96 hours after online publication and is updated daily on week days.
Initial download of the metrics may take a while.