Fig. 7.
Download original image
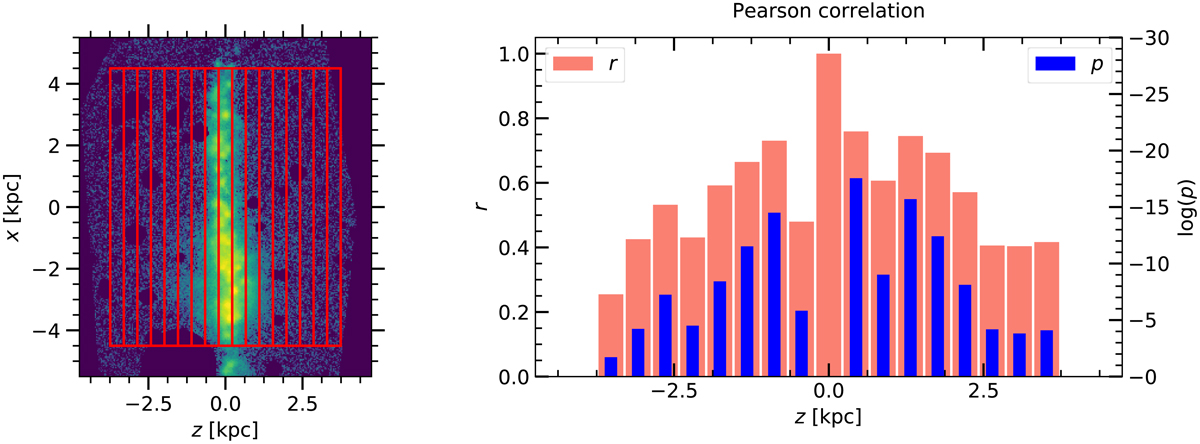
Disk–eDIG radial profile Pearson correlation at different heights for IC 217. Left panel: Hα image of the galaxy. Right panel: correlation coefficient (r; red bars) and the p-value (p; blue bars) at different heights (z). The red rectangles in the left panel correspond to the bins from which the eDIG radial profiles at different heights were measured.
Current usage metrics show cumulative count of Article Views (full-text article views including HTML views, PDF and ePub downloads, according to the available data) and Abstracts Views on Vision4Press platform.
Data correspond to usage on the plateform after 2015. The current usage metrics is available 48-96 hours after online publication and is updated daily on week days.
Initial download of the metrics may take a while.