Free Access
Fig. 5.
Download original image
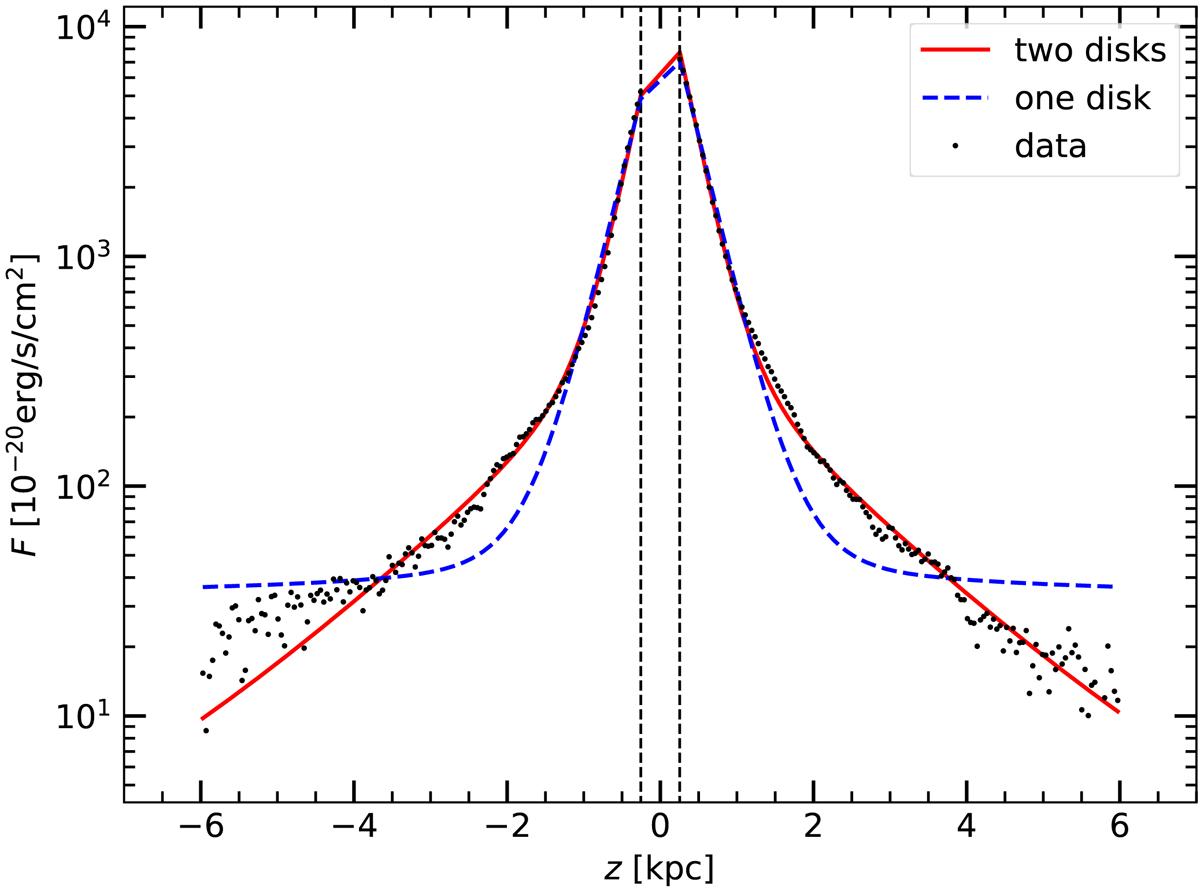
Comparison of vertical Hα profile fits of IC 1553 using our double-exponential model (solid red line) and single-exponential model with a constant background (dashed blue line). Black dots show the measured fluxes, and the black vertical dashed lines show the extent of the thin disk.
Current usage metrics show cumulative count of Article Views (full-text article views including HTML views, PDF and ePub downloads, according to the available data) and Abstracts Views on Vision4Press platform.
Data correspond to usage on the plateform after 2015. The current usage metrics is available 48-96 hours after online publication and is updated daily on week days.
Initial download of the metrics may take a while.