Fig. 4.
Download original image
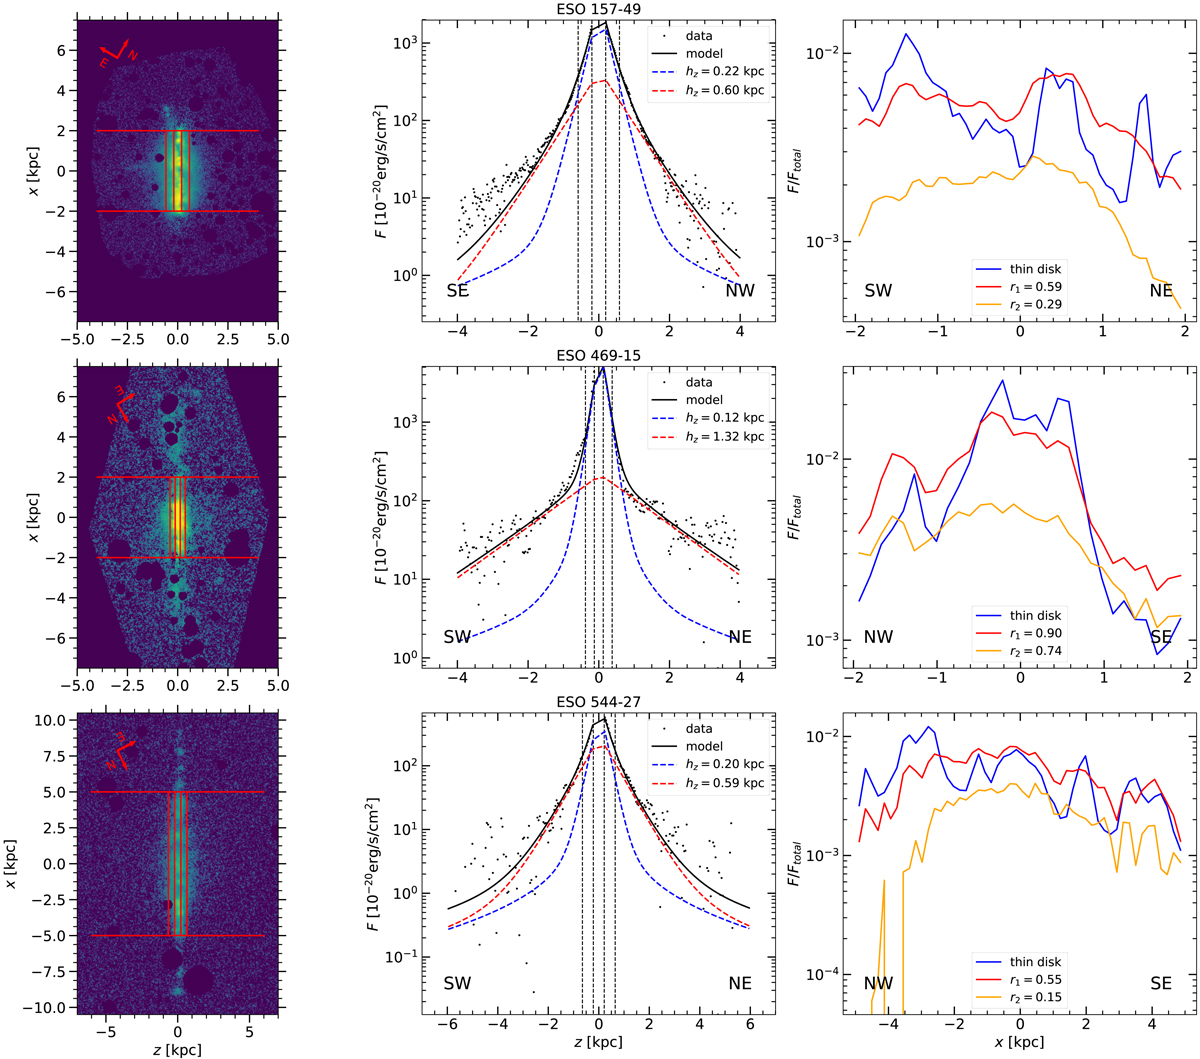
Masked narrowband Hα images (left) and vertical (center) and radial (right) Hα profiles for our sample. Black dots in the center column show measured fluxes, and the black curves show our two-component exponential fits. The dashed blue curve in the center column is the thinner component of the fit, representing the quiescent phase of the DIG. The dashed red curve in the center column is the thicker component of the fit, representing the disturbed eDIG. The fit scale heights are shown for both components in the legends of the center column. The vertical dashed black lines in the center column are the inner limits of lenient (inner) and stringent (outer) eDIG definitions (see text). These are also shown in the Hα images of the left column via the vertical solid red lines. The horizontal solid red lines in the left column show the radial extent of the thin disk and eDIG definitions. In the right column the solid blue lines represents the thin disk radial Hα profiles, the solid red lines represents the eDIG radial Hα profiles using the lenient eDIG definition (eDIG1), and the solid orange lines represent the eDIG radial Hα profiles using the stringent eDIG definition (eDIG2). The thin disk and lenient eDIG radial profiles are normalized to unity flux, and the stringent eDIG radial profiles are normalized to the flux of the lenient eDIG flux to highlight the similarities between the profiles. The disk–eDIG Pearson r values are shown in the legends of the right column. Directions on the sky are indicated in the images and the plots.
Current usage metrics show cumulative count of Article Views (full-text article views including HTML views, PDF and ePub downloads, according to the available data) and Abstracts Views on Vision4Press platform.
Data correspond to usage on the plateform after 2015. The current usage metrics is available 48-96 hours after online publication and is updated daily on week days.
Initial download of the metrics may take a while.