Fig. 3.
Download original image
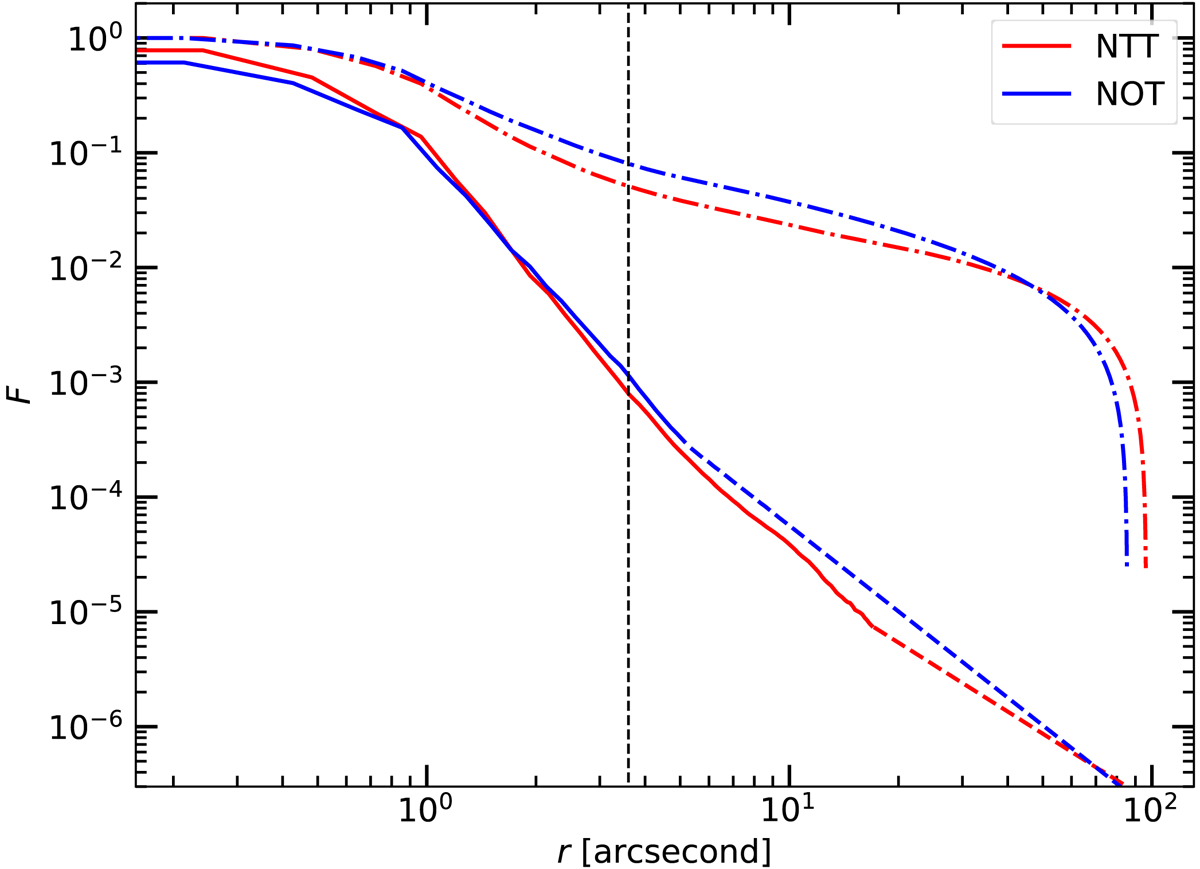
PSF radial profiles measured and extrapolated from our NTT (red lines) and NOT (blue lines) data. The dashed lines show the extrapolated power-law wings. The dot-dashed lines indicate the fractional cumulative flux outside a given distance from the center. The black vertical dashed line corresponds to the separation between the averaged core PSF and the bright star middle section at 3![]() 6 for the NTT PSF. The NTT PSF is normalized to its maximum value, and the NOT PSF is normalized so that it has a total flux equal to the NTT PSF.
6 for the NTT PSF. The NTT PSF is normalized to its maximum value, and the NOT PSF is normalized so that it has a total flux equal to the NTT PSF.
Current usage metrics show cumulative count of Article Views (full-text article views including HTML views, PDF and ePub downloads, according to the available data) and Abstracts Views on Vision4Press platform.
Data correspond to usage on the plateform after 2015. The current usage metrics is available 48-96 hours after online publication and is updated daily on week days.
Initial download of the metrics may take a while.