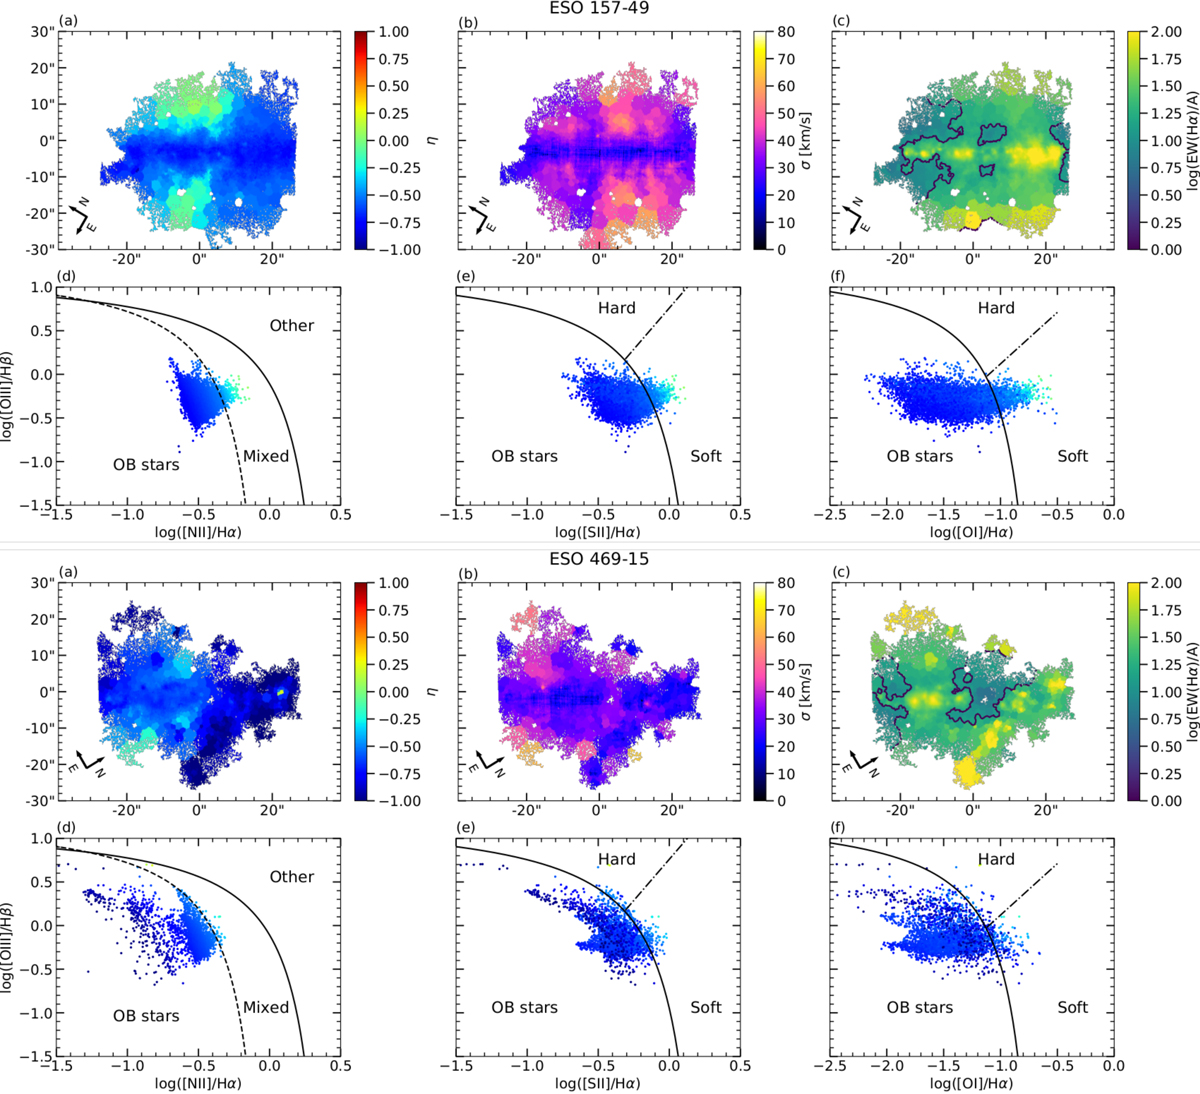
Fig. 14.
Download original image
Emission-line properties in our sample galaxies. (a) η-parameter maps (Erroz-Ferrer et al. 2019). (b) Velocity dispersion maps. (c) Logarithmic EW(Hα) maps. (d), (e), (f) VO diagrams. The solid line in the VO diagrams is the Kewley et al. (2001) extreme starburst line, the dashed line is the Kauffmann et al. (2003a) empirical starburst line, and the dash-dot line is the Kewley et al. (2006) Seyfert-LINER demarcation line. The colors in the VO diagrams correspond to the colors in the η-parameter maps. The lower limit of the OB-star-dominated ionization (EW(Hα) = 14 Å) is contoured in black on the EW(Hα) maps.
Current usage metrics show cumulative count of Article Views (full-text article views including HTML views, PDF and ePub downloads, according to the available data) and Abstracts Views on Vision4Press platform.
Data correspond to usage on the plateform after 2015. The current usage metrics is available 48-96 hours after online publication and is updated daily on week days.
Initial download of the metrics may take a while.