Fig. 13.
Download original image
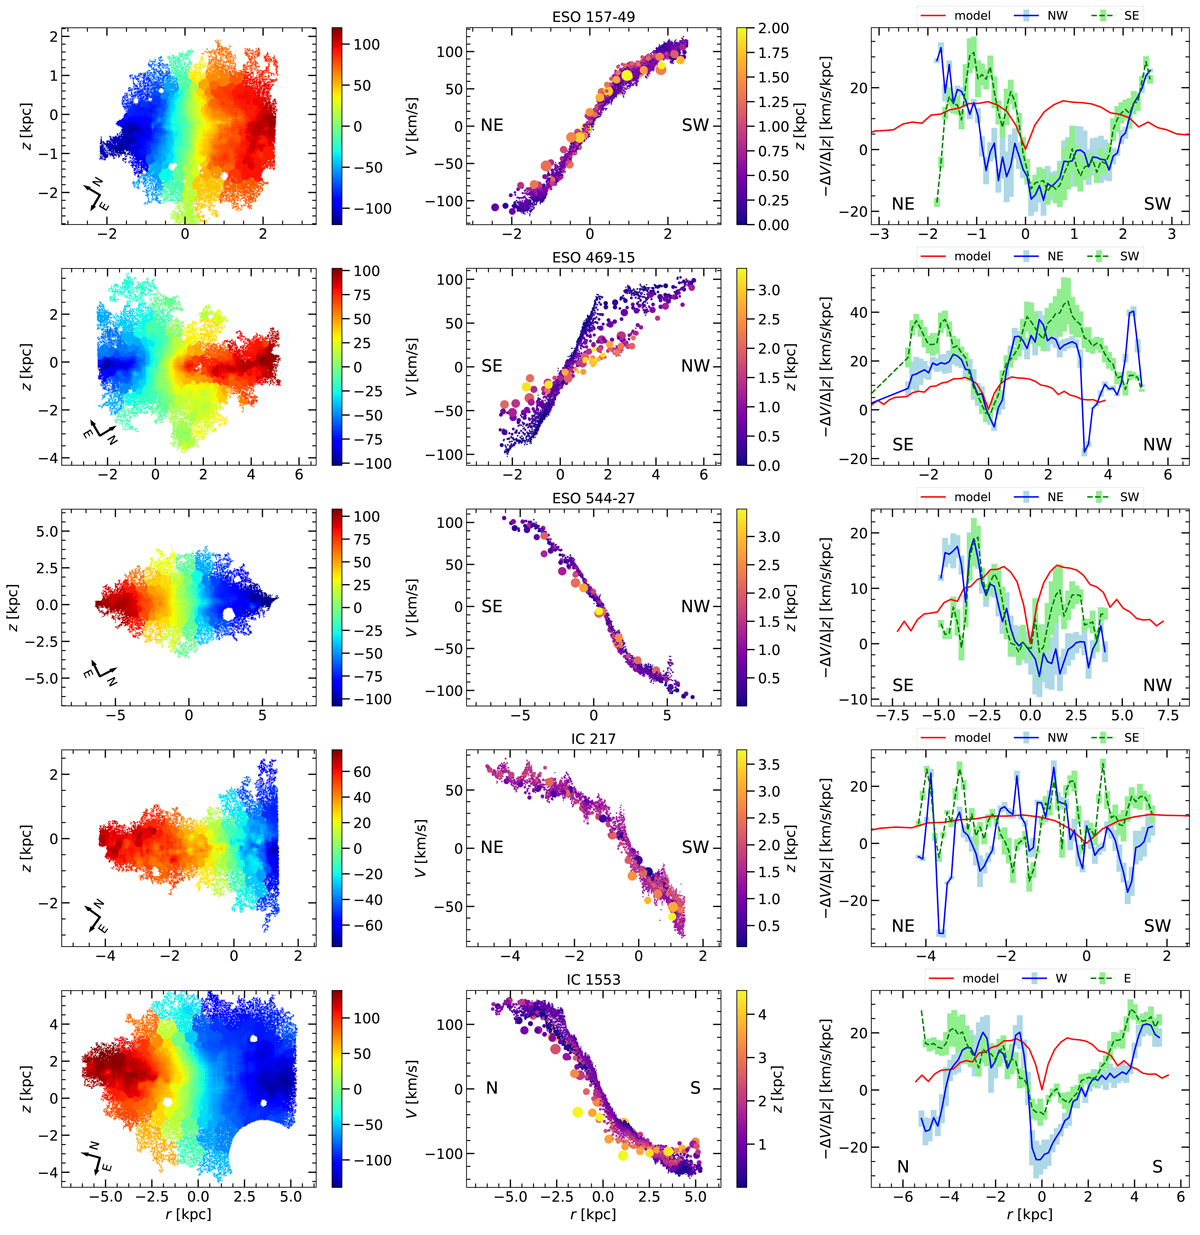
Velocity maps (left), PV diagrams (middle), and lag profiles (right) for the galaxies of our sample. The size of the points in the middle column corresponds to the size of the Voronoi bins they represent. The red curves in the right column show the lag profile of our N-body simulation, scaled to the maximum rotation velocity and to the scale length of the galaxy; this profile corresponds to circular orbits in a steady axisymmetric potential. The solid blue lines and the dashed green lines in the right column show the measured lags above and below the midplane of the galaxy, with the direction indicated in the legend. The uncertainties of the two lag fits are shown in lighter colors. Directions on the sky are indicated in the plots.
Current usage metrics show cumulative count of Article Views (full-text article views including HTML views, PDF and ePub downloads, according to the available data) and Abstracts Views on Vision4Press platform.
Data correspond to usage on the plateform after 2015. The current usage metrics is available 48-96 hours after online publication and is updated daily on week days.
Initial download of the metrics may take a while.