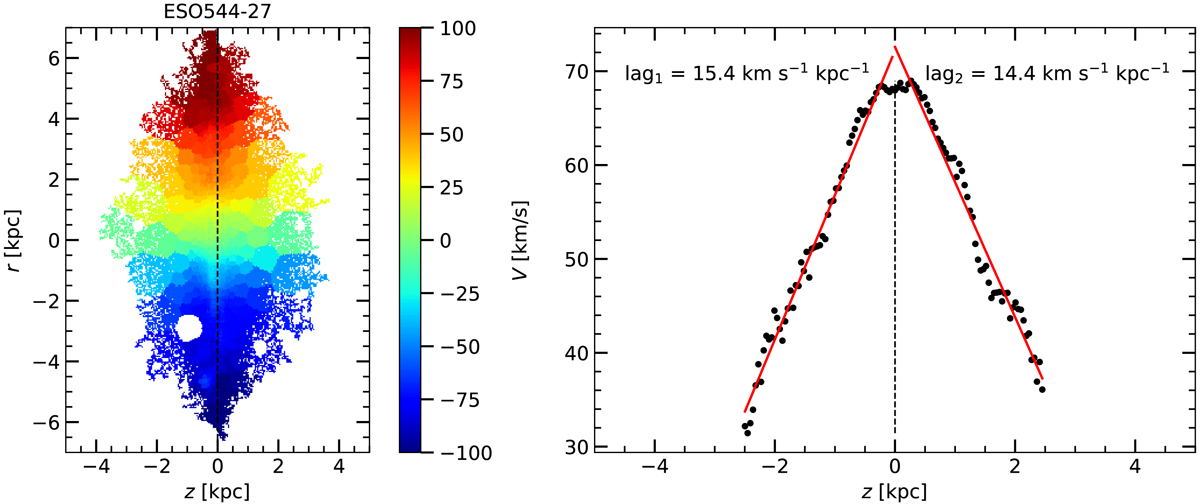
Fig. 12.
Download original image
Velocity lag in ESO 544-27. Left panel: velocity map. Right panel: vertical velocity profile. The velocity profile has been obtained by averaging the absolute velocity at each height. The black dashed line in both the map and the profile indicates the midplane. The black dots show the measured velocities, and the red lines show the fits to the velocity profile on both sides of the midplane. The absolute values of the slopes of the lines, or the lags above and below the midplane, are given in the right panel.
Current usage metrics show cumulative count of Article Views (full-text article views including HTML views, PDF and ePub downloads, according to the available data) and Abstracts Views on Vision4Press platform.
Data correspond to usage on the plateform after 2015. The current usage metrics is available 48-96 hours after online publication and is updated daily on week days.
Initial download of the metrics may take a while.