Fig. 7
Download original image
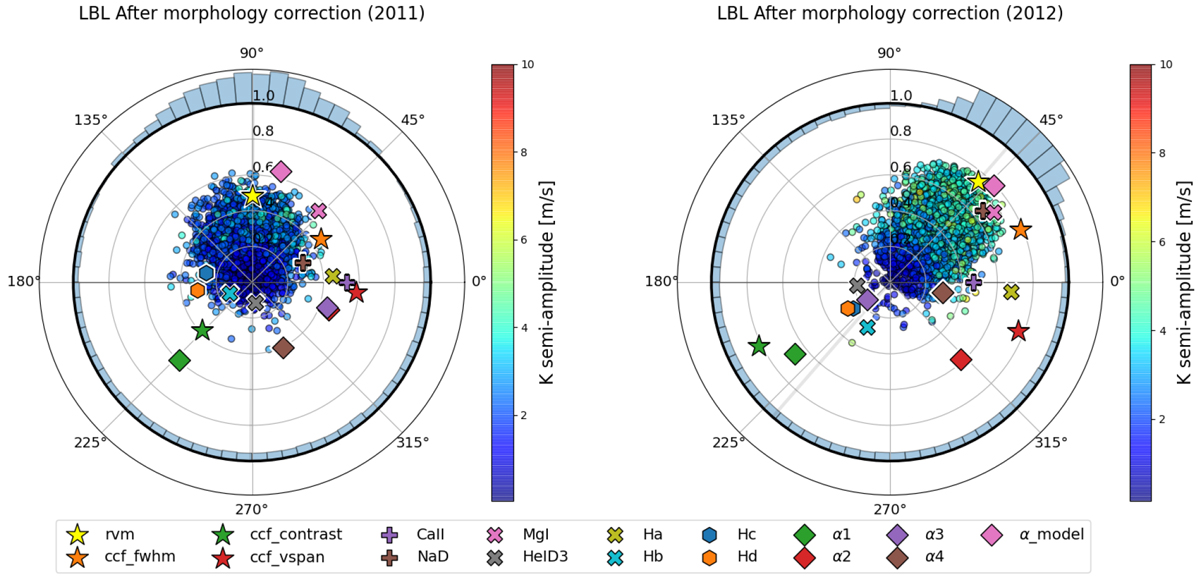
Polar periodogram for the 2011 and 2012 HD 128621 datasets after YARARA correction. For 2012, the highest peaks in the periodogram correspond to a period of 40 days, so we display the polar periodogram at 40 days rather than36 days. A clear time-lag between the RV variation of each line and the CaII H&K (purple cross) of ϕ ~ 90° (9 days) and ϕ ~ 45° (5 days) is visible in 2011 and 2012, respectively. The RVs are however in phase with the multi-linear model of αj (pink square) as well as with the CCF FWHM (orange star).
Current usage metrics show cumulative count of Article Views (full-text article views including HTML views, PDF and ePub downloads, according to the available data) and Abstracts Views on Vision4Press platform.
Data correspond to usage on the plateform after 2015. The current usage metrics is available 48-96 hours after online publication and is updated daily on week days.
Initial download of the metrics may take a while.