Fig. 6
Download original image
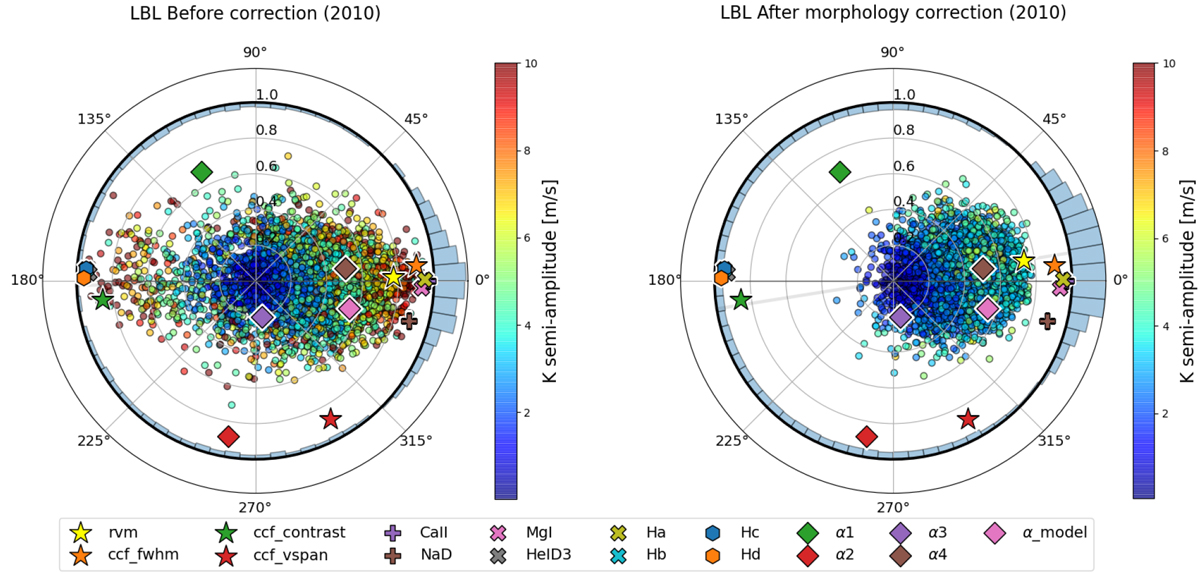
Polar periodogram for the 2010 HD 128621 dataset obtained for a fixed period of 36 days, known to be the stellar rotation period of HD 128621. Each dot represents a spectral line. Peculiar activity proxies and αj (t) coefficient time series are shown as markers of different types (see legend). The radial coordinate is the weighted ![]() Pearson coefficient value obtained between each LBL RV (or an activity proxy) and the best-fitting sinusoidal to the corresponding LBL RV (similar to the GLS periodogram power). The polar angle is the phase of the fitted sinusoidal, the reference ϕ = 0° is defined asthe phase obtained for the CaII H&K time series. The external histogram indicate the angular distribution compared to an isotropic distribution highlighted by the thick black circle. Histogram bins touching the most external circle are at5 sigmas. Left: prior to the YARARA correction. A number of stellar lines contain anti-correlated lines (ϕ = 180°) with respect to the CaII H&K time series. Right: same as left after YARARA post-processing. All the previous anti-correlated lines disappear and we are only left with correlated lines (ϕ = 0°).
Pearson coefficient value obtained between each LBL RV (or an activity proxy) and the best-fitting sinusoidal to the corresponding LBL RV (similar to the GLS periodogram power). The polar angle is the phase of the fitted sinusoidal, the reference ϕ = 0° is defined asthe phase obtained for the CaII H&K time series. The external histogram indicate the angular distribution compared to an isotropic distribution highlighted by the thick black circle. Histogram bins touching the most external circle are at5 sigmas. Left: prior to the YARARA correction. A number of stellar lines contain anti-correlated lines (ϕ = 180°) with respect to the CaII H&K time series. Right: same as left after YARARA post-processing. All the previous anti-correlated lines disappear and we are only left with correlated lines (ϕ = 0°).
Current usage metrics show cumulative count of Article Views (full-text article views including HTML views, PDF and ePub downloads, according to the available data) and Abstracts Views on Vision4Press platform.
Data correspond to usage on the plateform after 2015. The current usage metrics is available 48-96 hours after online publication and is updated daily on week days.
Initial download of the metrics may take a while.