Fig. C.1
Download original image
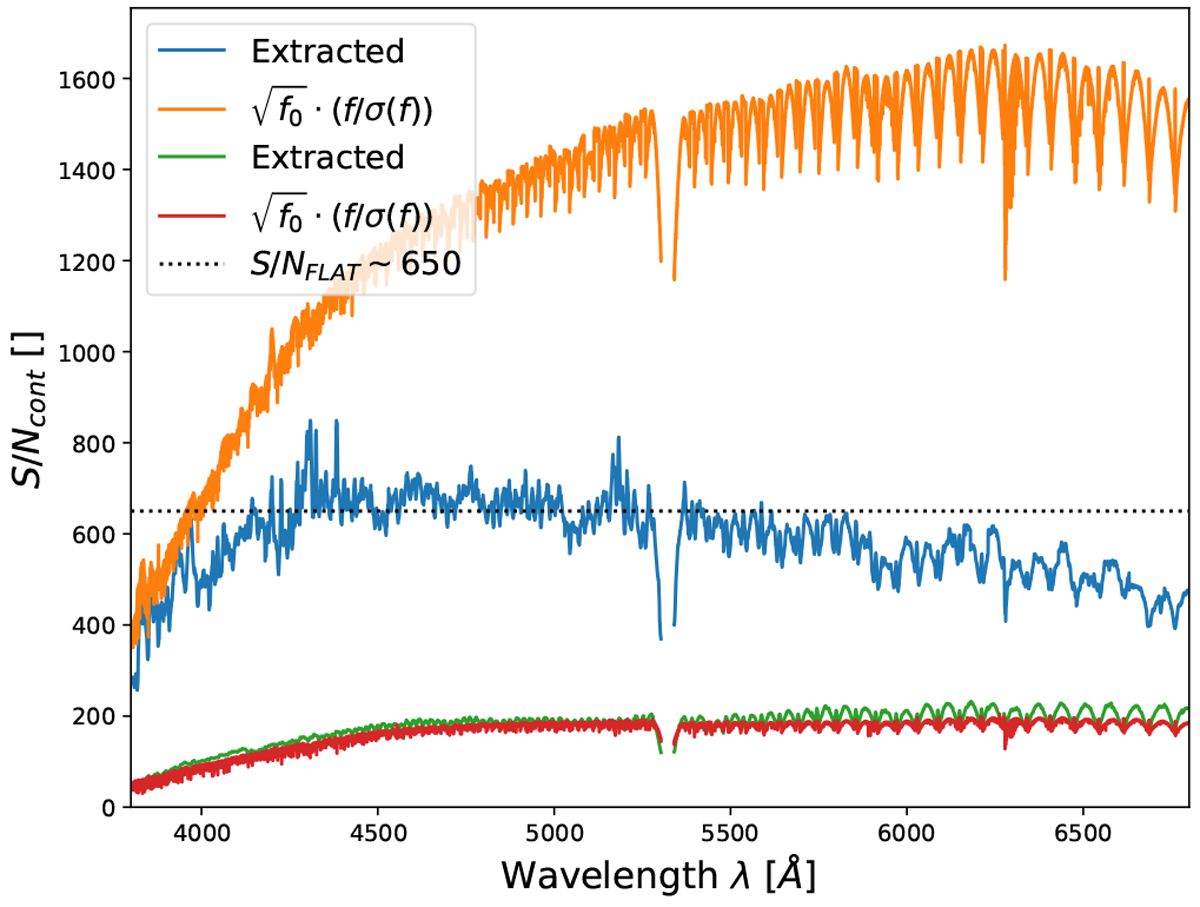
Examples of computed S/N![]() using the inverse of 1.48 times a rolling MAD in YARARA river diagram maps (labeled as ’extracted’) and compared with the theoretical S∕Ncont value if only photon-noise limited. In the case of a star photon-noise limited with S/Ncont ~ 200, both methods produce similar values (green and red curves). For a spectrum flat-field limited as for HD 128621 observations (blue and orange curves), the S∕Ncont is saturated to the S∕Ncont of the flat-field raw frames (black dashed line).
using the inverse of 1.48 times a rolling MAD in YARARA river diagram maps (labeled as ’extracted’) and compared with the theoretical S∕Ncont value if only photon-noise limited. In the case of a star photon-noise limited with S/Ncont ~ 200, both methods produce similar values (green and red curves). For a spectrum flat-field limited as for HD 128621 observations (blue and orange curves), the S∕Ncont is saturated to the S∕Ncont of the flat-field raw frames (black dashed line).
Current usage metrics show cumulative count of Article Views (full-text article views including HTML views, PDF and ePub downloads, according to the available data) and Abstracts Views on Vision4Press platform.
Data correspond to usage on the plateform after 2015. The current usage metrics is available 48-96 hours after online publication and is updated daily on week days.
Initial download of the metrics may take a while.