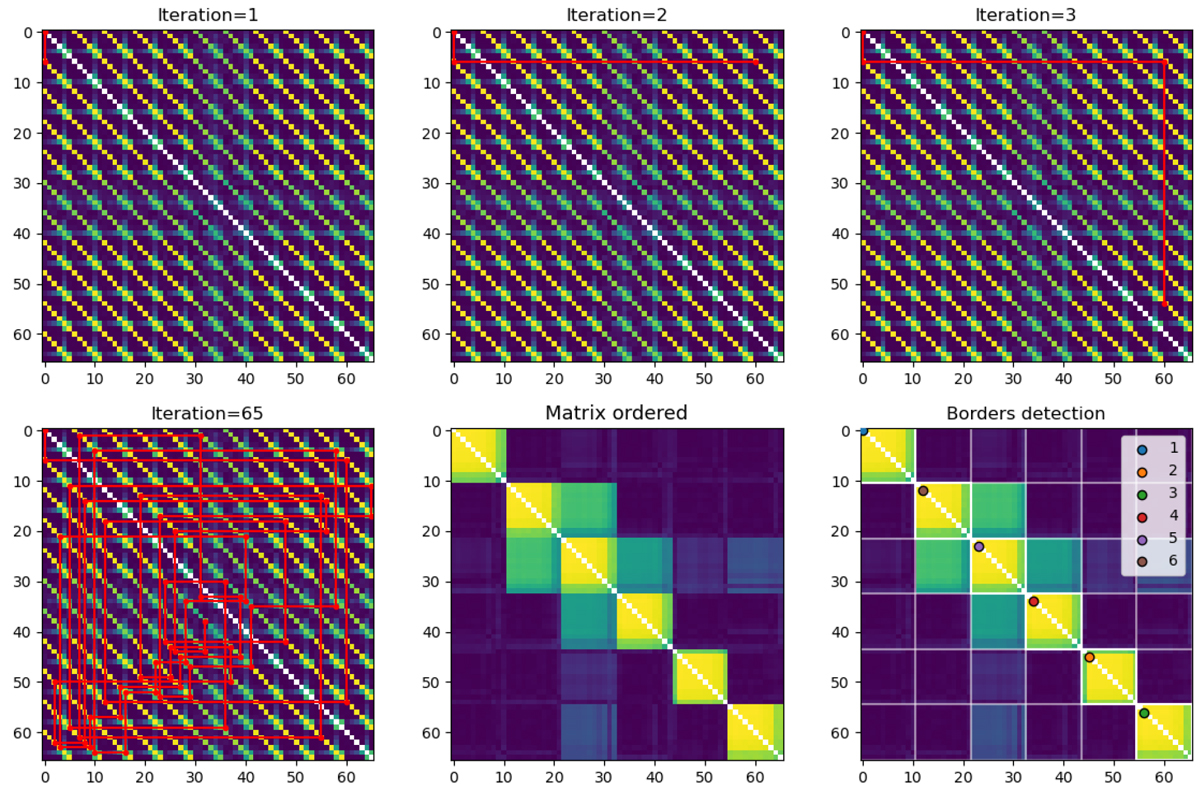
Fig. B.1
Download original image
Illustration of the cross-validation algorithm used to measured the occurrence rate of the components through the correlation matrix MR of the vectors. The colour scale is arbitrary. Six vectors with different periods, P, (from 10 to 60 days by steps of 10 days) and ten different amplitudes were used to simulate the typical output of a PCA algorithm. The 6 ⋅ (10 + 1) = 66 components therefore produce a 66 × 66 correlation matrix, MR. The signals at longest periods (component 4, 5 and 6) start to be collinear due to the baseline of the observations (60 days). Top row: first iterations of the ordering algorithm. Bottom left: final chain as detected by the ranking algorithm. Bottom middle: same as top left after the correlation matrix has been reordered. Bottom right: border detection as given by the borders algorithm. Each cluster is clearly detected and contains a single primary components, P, (colour dots). The occurrence rate, r, of all the components are 100% in that case. The borders (vertical and horizontal white lines) can be used to define a smaller matrix R′ (here 6 × 6) which can be reordered iteratively in case of bad chain ordering which did not happened in that simulation.
Current usage metrics show cumulative count of Article Views (full-text article views including HTML views, PDF and ePub downloads, according to the available data) and Abstracts Views on Vision4Press platform.
Data correspond to usage on the plateform after 2015. The current usage metrics is available 48-96 hours after online publication and is updated daily on week days.
Initial download of the metrics may take a while.