Fig. 14
Download original image
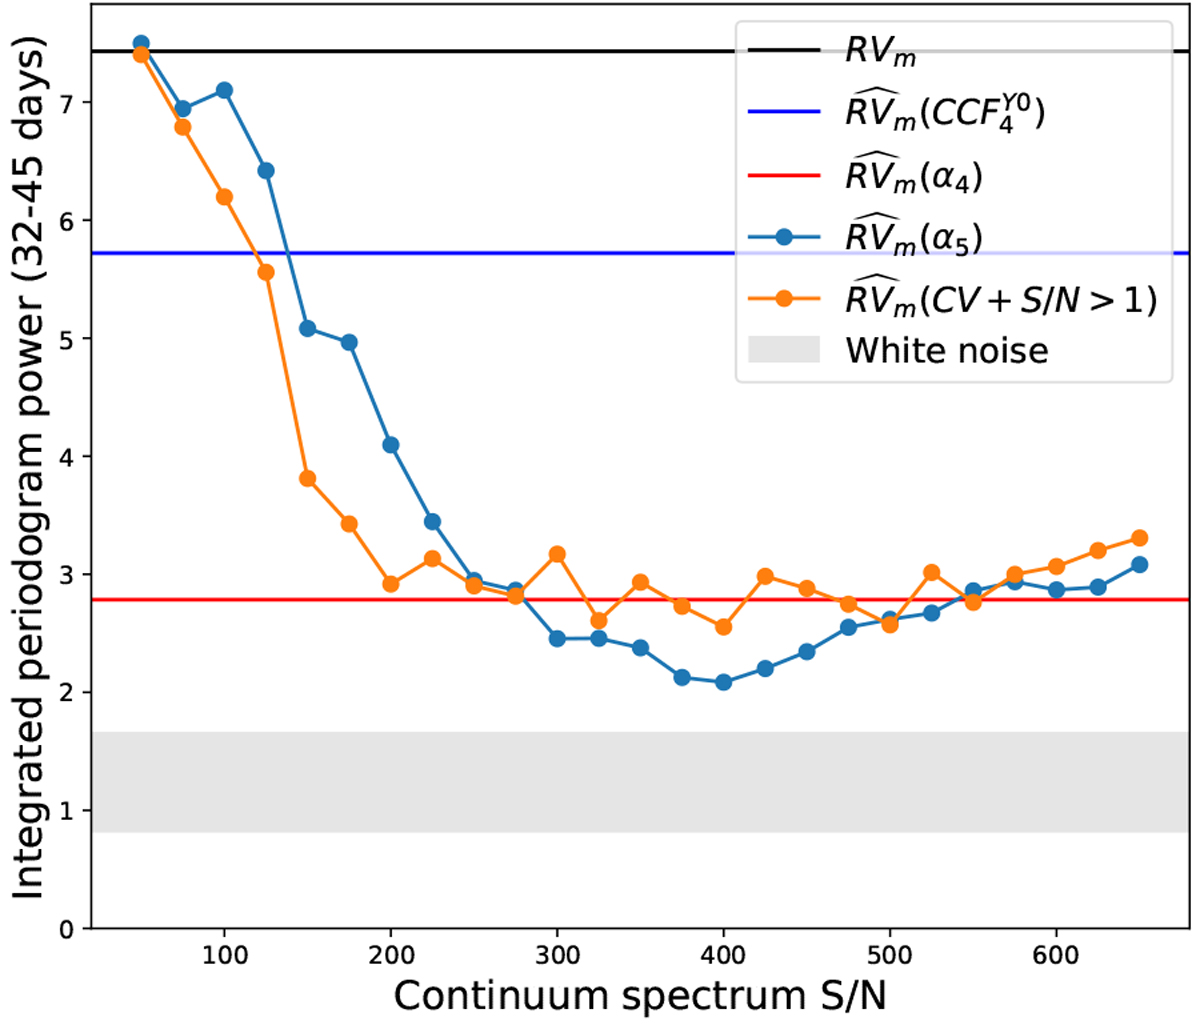
Noise injection tests performed on HD 128621 to evaluate the performance of our shell framework in mitigating stellar activity. In this figure, we show the dependence between the integrated power of signals between 32 and 45 days, which contain mostly stellar activity signal, and the S∕Ncont. Previous values mentioned in Fig. 11 and obtained at observed S∕Ncont values (~650) are reported (solid horizontal lines). Activating the cross-validation algorithm to select only shell basis component with significant signal and imposing the S∕N > 1 criterion to reject noisy shell elements allow to mitigate significantly stellar activity starting at a S∕Ncont = 200 (orange curve) instead of S∕Ncont = 250 (blue curve). One thousand random realisations of white noise with the time samplingof the data were produced to get a reference power value, given at ± 1σ (gray area).
Current usage metrics show cumulative count of Article Views (full-text article views including HTML views, PDF and ePub downloads, according to the available data) and Abstracts Views on Vision4Press platform.
Data correspond to usage on the plateform after 2015. The current usage metrics is available 48-96 hours after online publication and is updated daily on week days.
Initial download of the metrics may take a while.