Fig. 12
Download original image
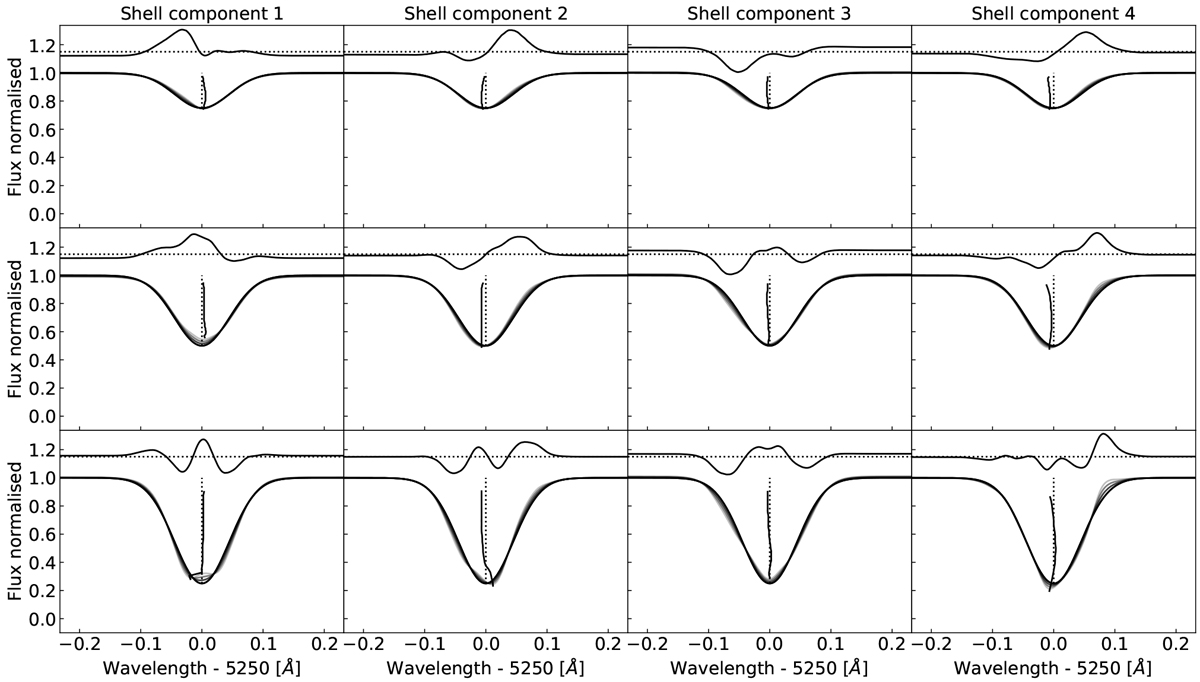
Inverse projection of the four significant PCA shell basis components, shown on the left of Fig. 8, used to correct the RV time series of α Cen B. The inverse projection was realised for Gaussian line profiles at 5250 Å with a FWHM equivalent to 6 km s−1 and threedifferent line depths (0.2, 0.45, and 0.7, from top to bottom). The delta flux variations, δf, evaluated along the line profile chord (see Fig. 1) are indicated after magnification above the Gaussian line profile and compared with δf = 0 (horizontal dotted line). The bisector of each line profile is also indicated after magnification and compared to the initial Gaussian profile (vertical dotted lines).
Current usage metrics show cumulative count of Article Views (full-text article views including HTML views, PDF and ePub downloads, according to the available data) and Abstracts Views on Vision4Press platform.
Data correspond to usage on the plateform after 2015. The current usage metrics is available 48-96 hours after online publication and is updated daily on week days.
Initial download of the metrics may take a while.