Fig. 11
Download original image
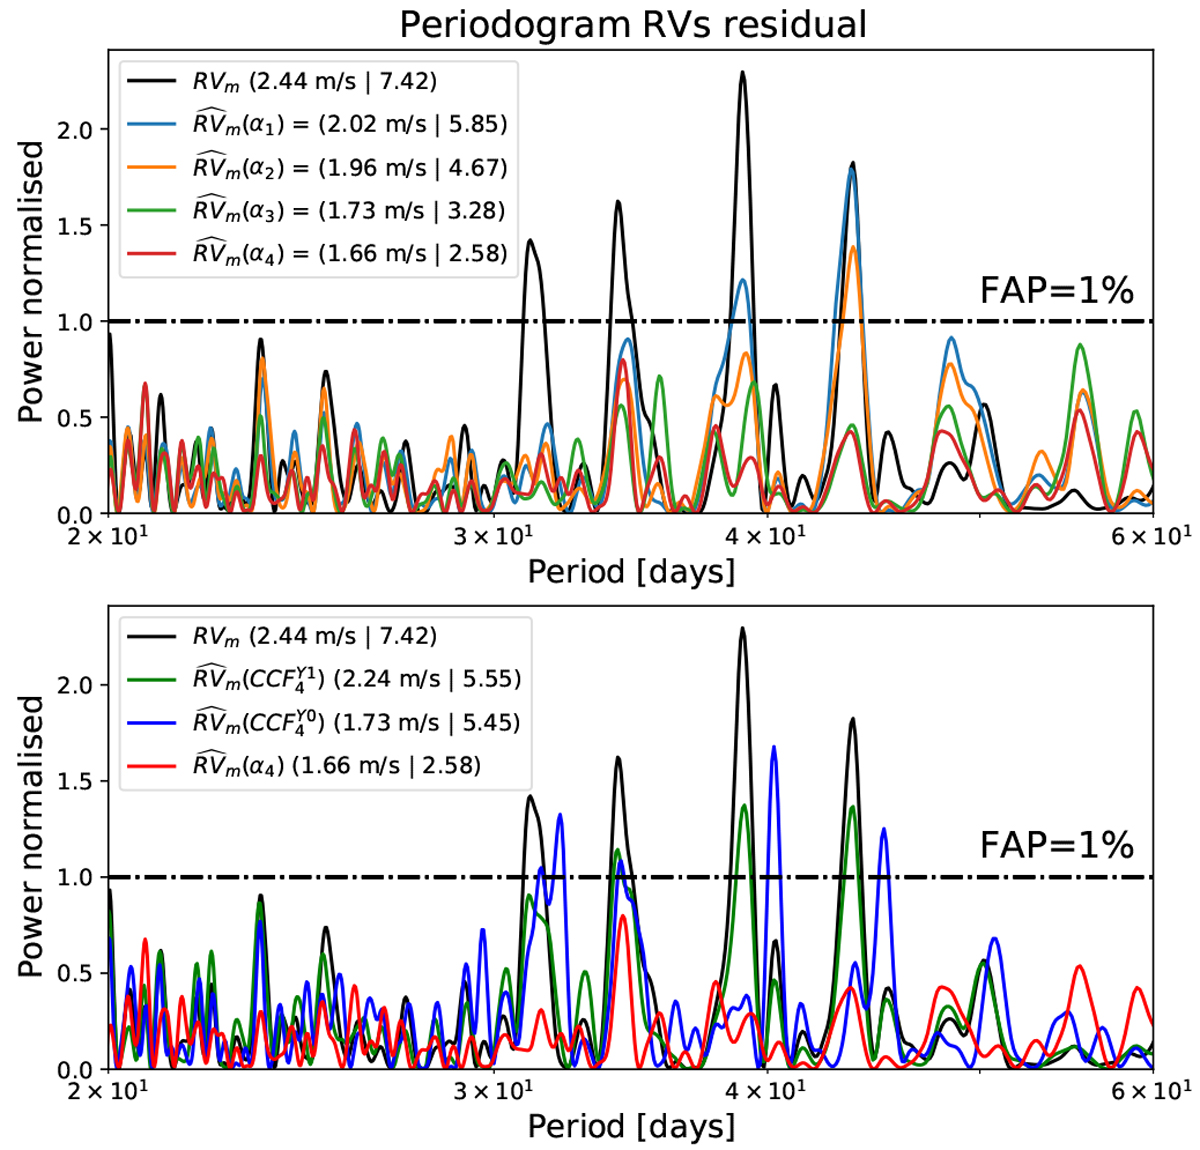
Periodograms of the residuals RVs parametrised by the model complexity (name convention as in Eq. (5)). All the periodograms are normalised according to their respective 1% FAP level (horizontal dotted-dashed line). The RV rms of the residuals for each model is indicated in the legend as well as the integrated power between 32 and 45 days. Top: results obtained by increasingly adding shell basis coefficients into the multi-linear model of Eq. (5). Once three shell basis coefficients are fitted, the rotational period is no more significant (green and red). Bottom: comparison between the residuals obtained after fitting for four shell basis coefficients (red) or the three classical CCF moments (FWHM, VSPAN and contrast) plus the CaII H&K. Both CCF moments before (CCFY 0, blue) and after YARARA processing (CCFY 1, green) were used.
Current usage metrics show cumulative count of Article Views (full-text article views including HTML views, PDF and ePub downloads, according to the available data) and Abstracts Views on Vision4Press platform.
Data correspond to usage on the plateform after 2015. The current usage metrics is available 48-96 hours after online publication and is updated daily on week days.
Initial download of the metrics may take a while.