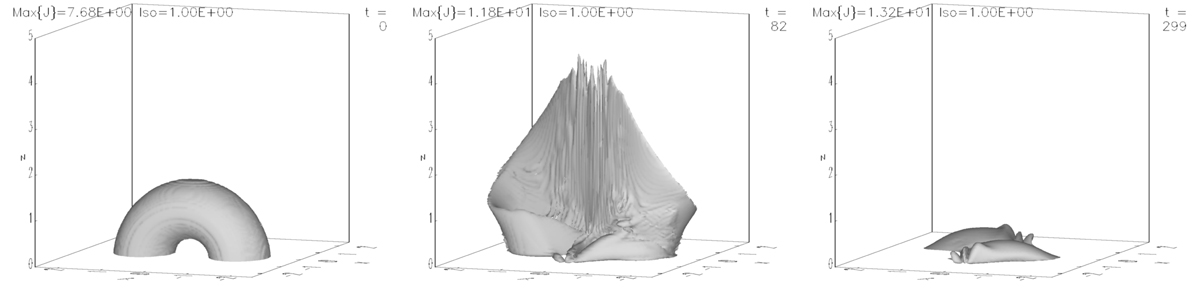
Fig. 3.
Download original image
Isosurfaces of current density, J, for Run T1 showing, from left to right: the initial flux rope; the vertical current sheet during the evolution of the instability (also wrapping around the bottom part of the flux rope legs in the form of a sigmoid); and the currents remaining after the eruption (which are already visible at t = 82).
Current usage metrics show cumulative count of Article Views (full-text article views including HTML views, PDF and ePub downloads, according to the available data) and Abstracts Views on Vision4Press platform.
Data correspond to usage on the plateform after 2015. The current usage metrics is available 48-96 hours after online publication and is updated daily on week days.
Initial download of the metrics may take a while.