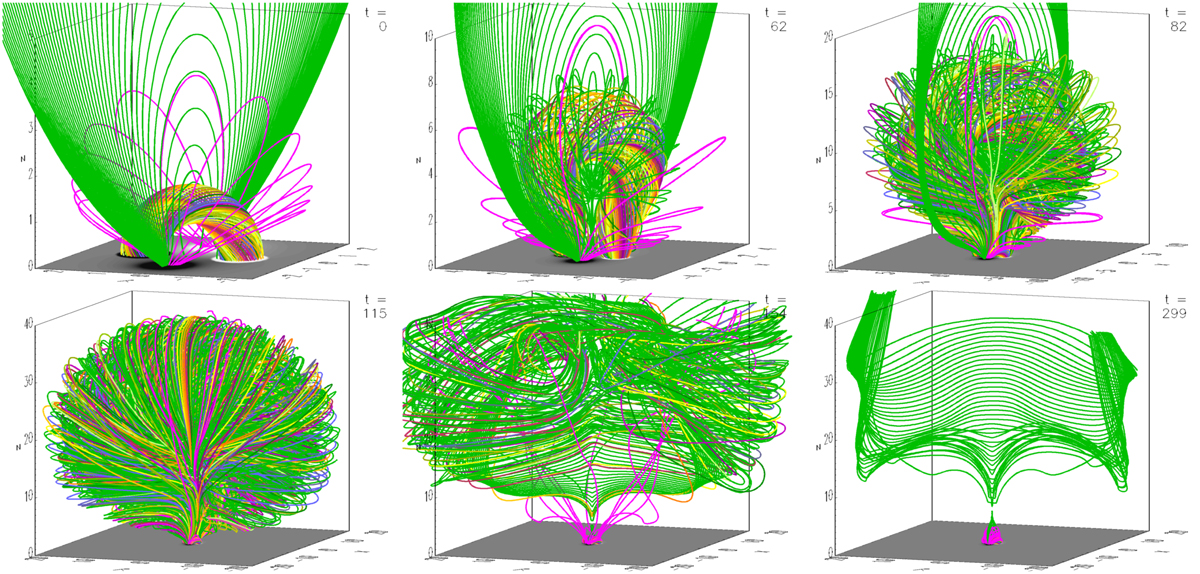
Fig. 2.
Download original image
Snapshots of the unstable flux rope in Run T1 visualized by rainbow-colored field lines. Green field lines are started at the z-axis (with uniform spacing) to visualize the overlying flux and the vertical current sheet that forms under the rising flux rope. Pink field lines visualize the ambient flux in the vicinity of the flux rope, which recloses after the eruption. The magnetogram, Bz(x, y, 0), is shown in gray scale; a logarithmic scaling is used because the sunspot flux is rather concentrated due to the small value of d.
Current usage metrics show cumulative count of Article Views (full-text article views including HTML views, PDF and ePub downloads, according to the available data) and Abstracts Views on Vision4Press platform.
Data correspond to usage on the plateform after 2015. The current usage metrics is available 48-96 hours after online publication and is updated daily on week days.
Initial download of the metrics may take a while.