Free Access
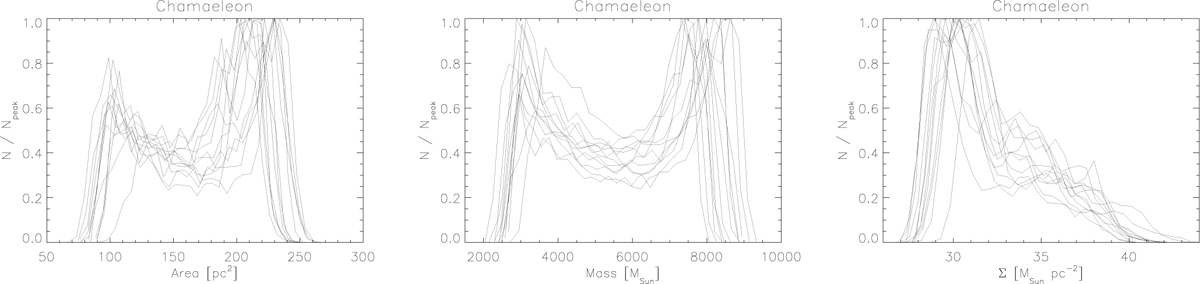
Fig. B.1.
Download original image
Probability distributions of area (left panel), mass (centre panel), and gas surface density (right panel) derived from the 12 posterior samples of the Leike et al. (2020) data for Chamaeleon. For visibility, the distributions are shown as lines instead of histogram columns.
Current usage metrics show cumulative count of Article Views (full-text article views including HTML views, PDF and ePub downloads, according to the available data) and Abstracts Views on Vision4Press platform.
Data correspond to usage on the plateform after 2015. The current usage metrics is available 48-96 hours after online publication and is updated daily on week days.
Initial download of the metrics may take a while.