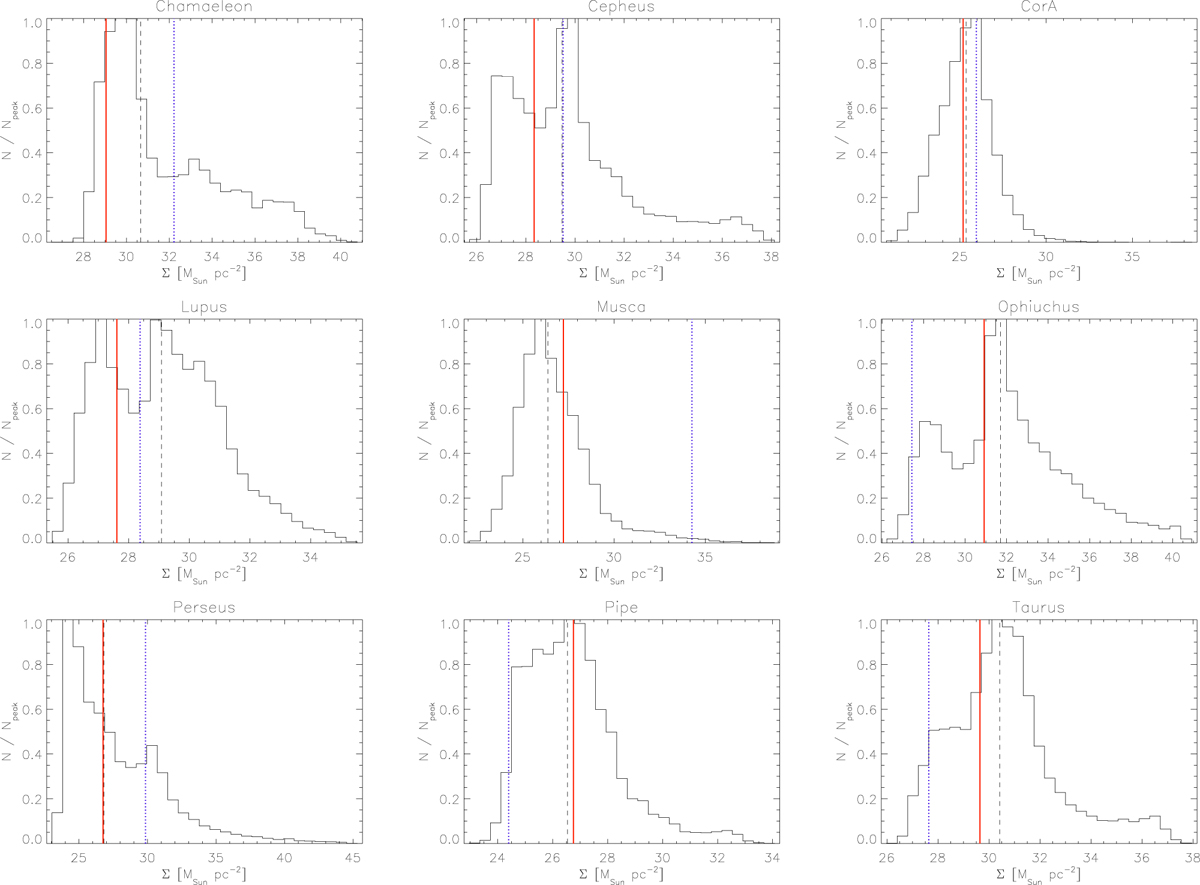
Fig. A.3.
Download original image
Frequency distributions of cloud surface densities for the molecular clouds in our sample, normalised to the peak. The data are derived using the threshold of AG = 0.75 mag. The dashed vertical line indicates the median value. The red line shows the surface density from the POS perspective (i.e. the observed value) and the blue dotted line from the face-on perspective (perpendicular to the Galactic disk).
Current usage metrics show cumulative count of Article Views (full-text article views including HTML views, PDF and ePub downloads, according to the available data) and Abstracts Views on Vision4Press platform.
Data correspond to usage on the plateform after 2015. The current usage metrics is available 48-96 hours after online publication and is updated daily on week days.
Initial download of the metrics may take a while.