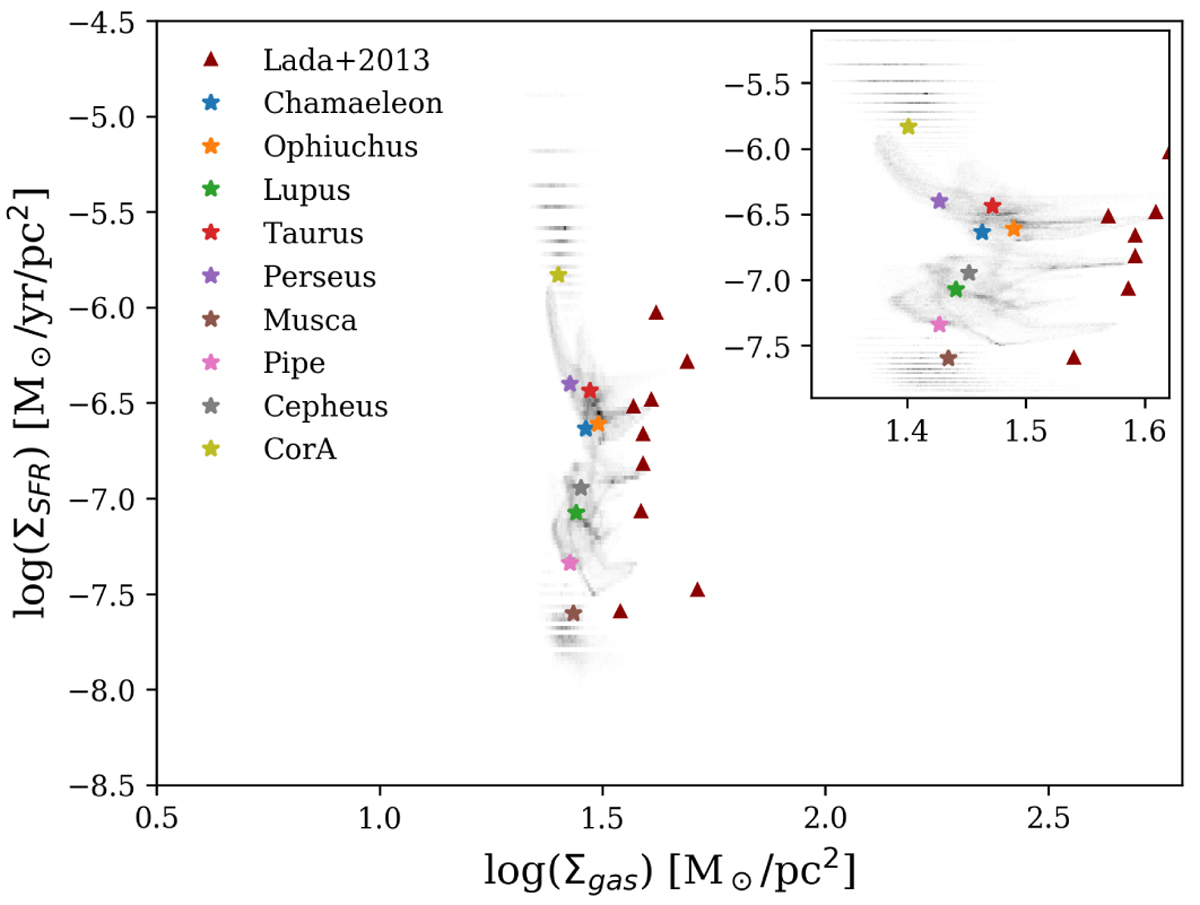
Fig. 3.
Download original image
Probability distributions of the sample clouds from various viewing angles in the KS plane (grey scale). The observed (POS) values of the clouds are shown with stars. The SFR data are from Lada et al. (2010). The dark red triangles show data from Lada et al. (2013). The inset shows a zoomed-in view to highlight the shape of the distributions.
Current usage metrics show cumulative count of Article Views (full-text article views including HTML views, PDF and ePub downloads, according to the available data) and Abstracts Views on Vision4Press platform.
Data correspond to usage on the plateform after 2015. The current usage metrics is available 48-96 hours after online publication and is updated daily on week days.
Initial download of the metrics may take a while.