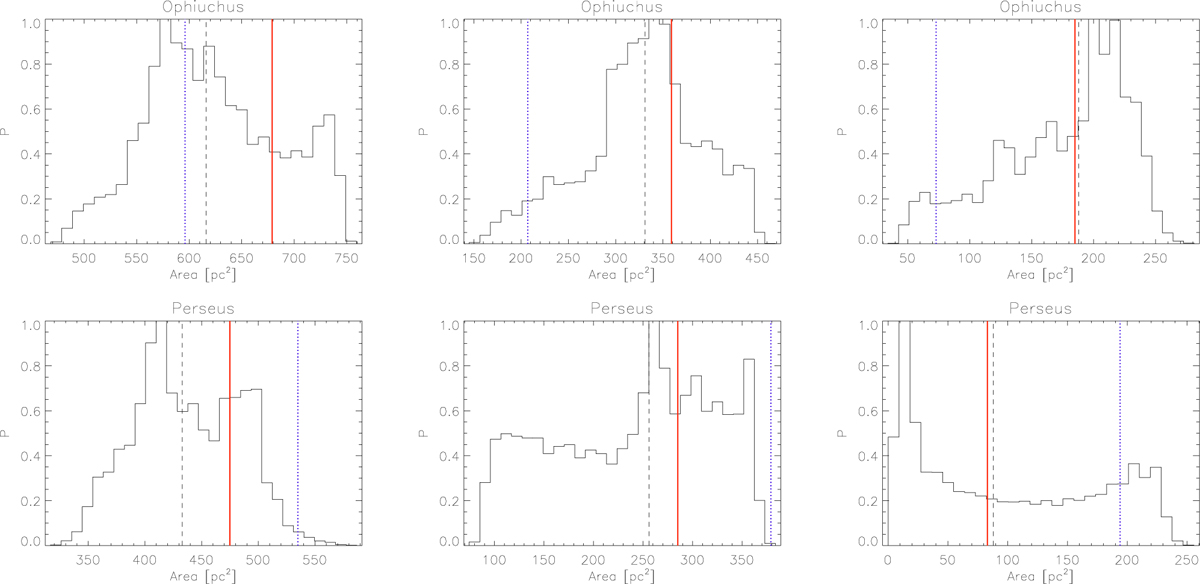
Fig. C.1.
Download original image
Frequency distributions of cloud areas for Ophiuchus and Perseus, derived using different threshold levels: AG = 0.5 mag (left panels), 0.75 mag (centre panels), and 1 mag (right panels). The dashed vertical line indicates the median value. The red line shows the area from the POS perspective (i.e. the observed area) and the blue dotted line from the face-on perspective (perpendicular to the Galactic disk).
Current usage metrics show cumulative count of Article Views (full-text article views including HTML views, PDF and ePub downloads, according to the available data) and Abstracts Views on Vision4Press platform.
Data correspond to usage on the plateform after 2015. The current usage metrics is available 48-96 hours after online publication and is updated daily on week days.
Initial download of the metrics may take a while.