Free Access
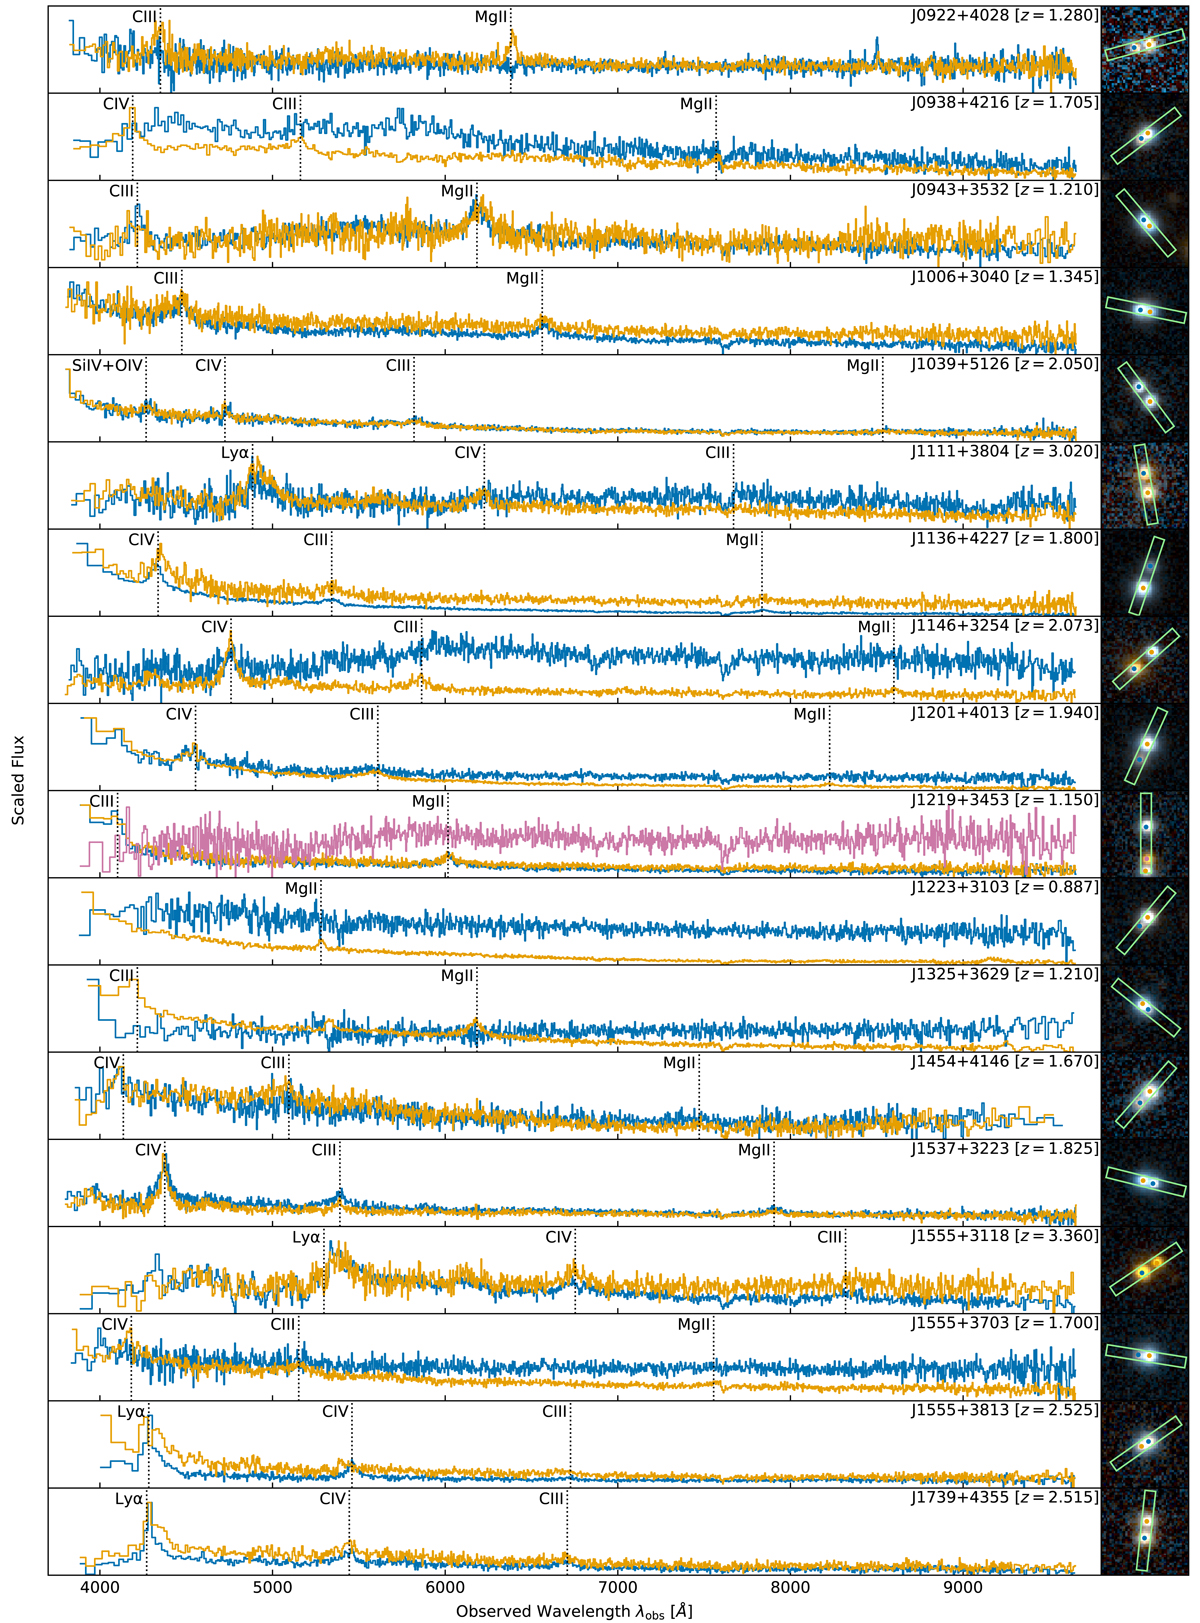
Fig. 6.
Download original image
Extracted 1D spectra of candidates observed with ALFOSC on the NOT. Redshifts are measured from the average of the peaks of broad emission lines. The CFIS colour image is shown to the right of each spectrum, with the slit position overlaid as a green box.
Current usage metrics show cumulative count of Article Views (full-text article views including HTML views, PDF and ePub downloads, according to the available data) and Abstracts Views on Vision4Press platform.
Data correspond to usage on the plateform after 2015. The current usage metrics is available 48-96 hours after online publication and is updated daily on week days.
Initial download of the metrics may take a while.