Fig. 5.
Download original image
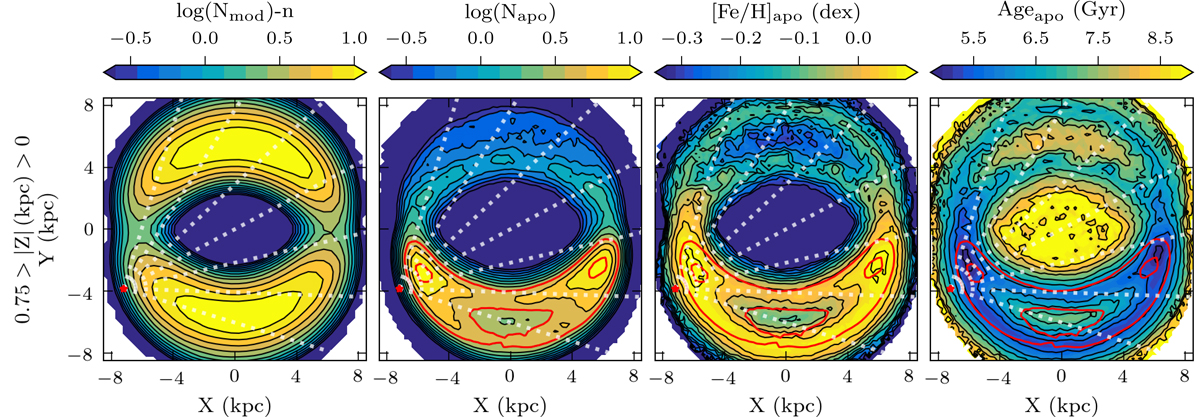
Orbital maps of the Y-asymmetric orbits with |Z|< 0.75 kpc and −1 < [Fe/H](dex) < 0.5. Left two plots: density maps built by superposing of model (left) and APOGEE stellar (right) Y-asymmetric orbits. The model density map has been normalised to a similar scale as the APOGEE density map using the factor n. Right two plots: mean [Fe/H] (left) and age (right) maps built from the Y-asymmetric APOGEE stellar orbits. The red contours in the APOGEE maps show specific density levels to guide the eye. For other plot details see Fig. 2.
Current usage metrics show cumulative count of Article Views (full-text article views including HTML views, PDF and ePub downloads, according to the available data) and Abstracts Views on Vision4Press platform.
Data correspond to usage on the plateform after 2015. The current usage metrics is available 48-96 hours after online publication and is updated daily on week days.
Initial download of the metrics may take a while.