Fig. 5.
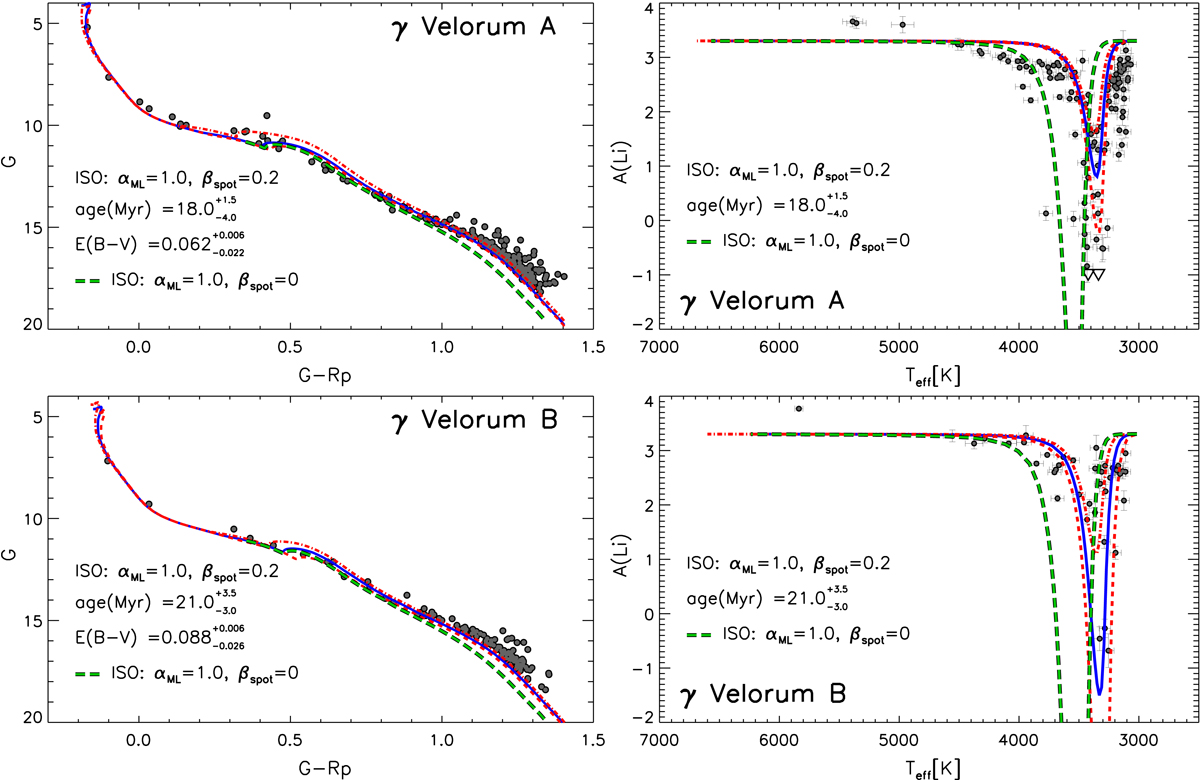
Download original image
Comparison of the data with the best-fit model in the CMD (left panels) and in the lithium–Teff plane (right panels) for Gamma Vel A (top) and Gamma Vel B (bottom). Errors on photometry are smaller than the symbol size. Open downward triangles in the lithium diagrams represent upper limits for A(Li). The best-fit model with αML = 1.0 and βspot = 0.2 is shown as a solid blue line, and the isochrones corresponding to the maximum and minimum age derived by the fitting method are shown as dashed and dot-dashed red lines, respectively. The long-dashed green line is the isochrone at the same age, reddening, and αML as the best-fit model, but with βspot = 0.
Current usage metrics show cumulative count of Article Views (full-text article views including HTML views, PDF and ePub downloads, according to the available data) and Abstracts Views on Vision4Press platform.
Data correspond to usage on the plateform after 2015. The current usage metrics is available 48-96 hours after online publication and is updated daily on week days.
Initial download of the metrics may take a while.