Fig. 4.
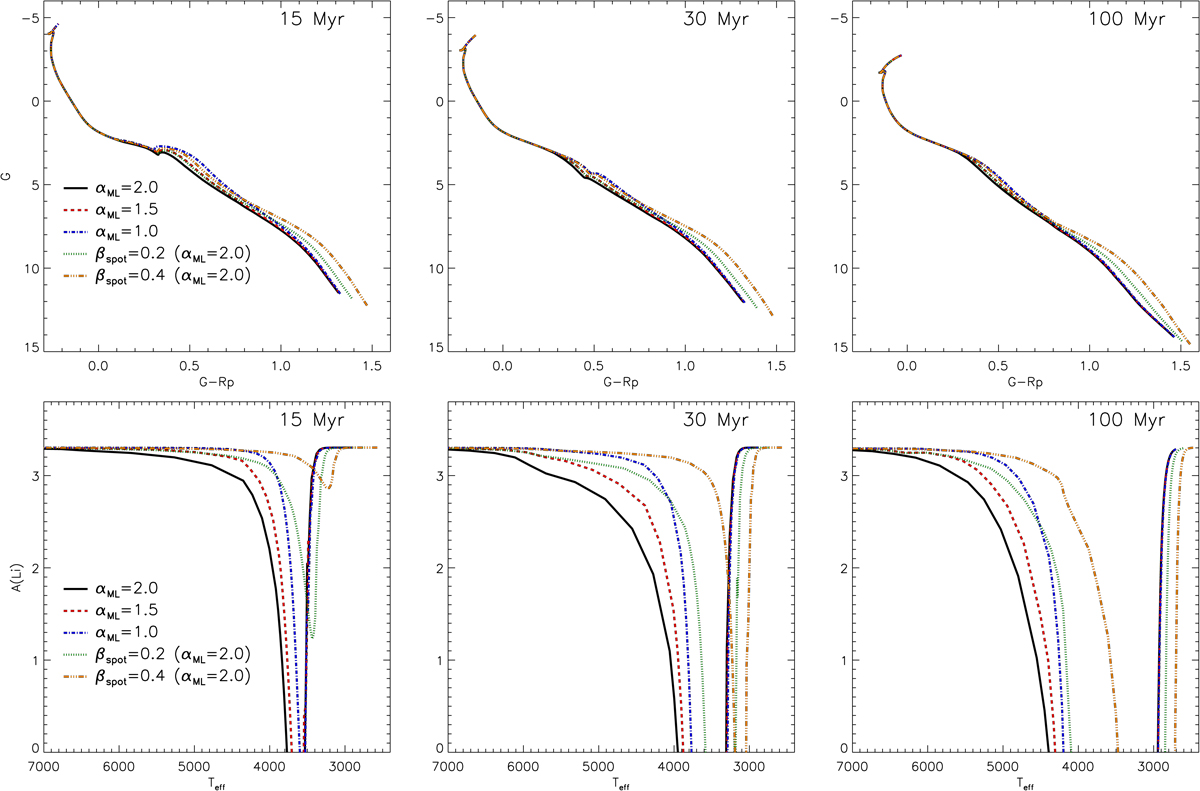
Download original image
Effect of adopting different values of αML and of different spot coverage fractions on the models at 15 Myr (left panels), 30 Myr (middle panels), and 100 Myr (right panels). The top row shows the effect on the CMD, and the bottom row presents the effect on the surface lithium abundance as a function of Teff. The standard reference model with αML = 2 and no spots is plotted as the solid black line. The dashed red and dot-dashed blue lines show the models without spots and αML = 1.5 and 1.0, respectively. The models with αML = 2 and βspot = 0.2 and 0.4 are indicated with the dotted green and three-dot-dashed orange lines, respectively.
Current usage metrics show cumulative count of Article Views (full-text article views including HTML views, PDF and ePub downloads, according to the available data) and Abstracts Views on Vision4Press platform.
Data correspond to usage on the plateform after 2015. The current usage metrics is available 48-96 hours after online publication and is updated daily on week days.
Initial download of the metrics may take a while.