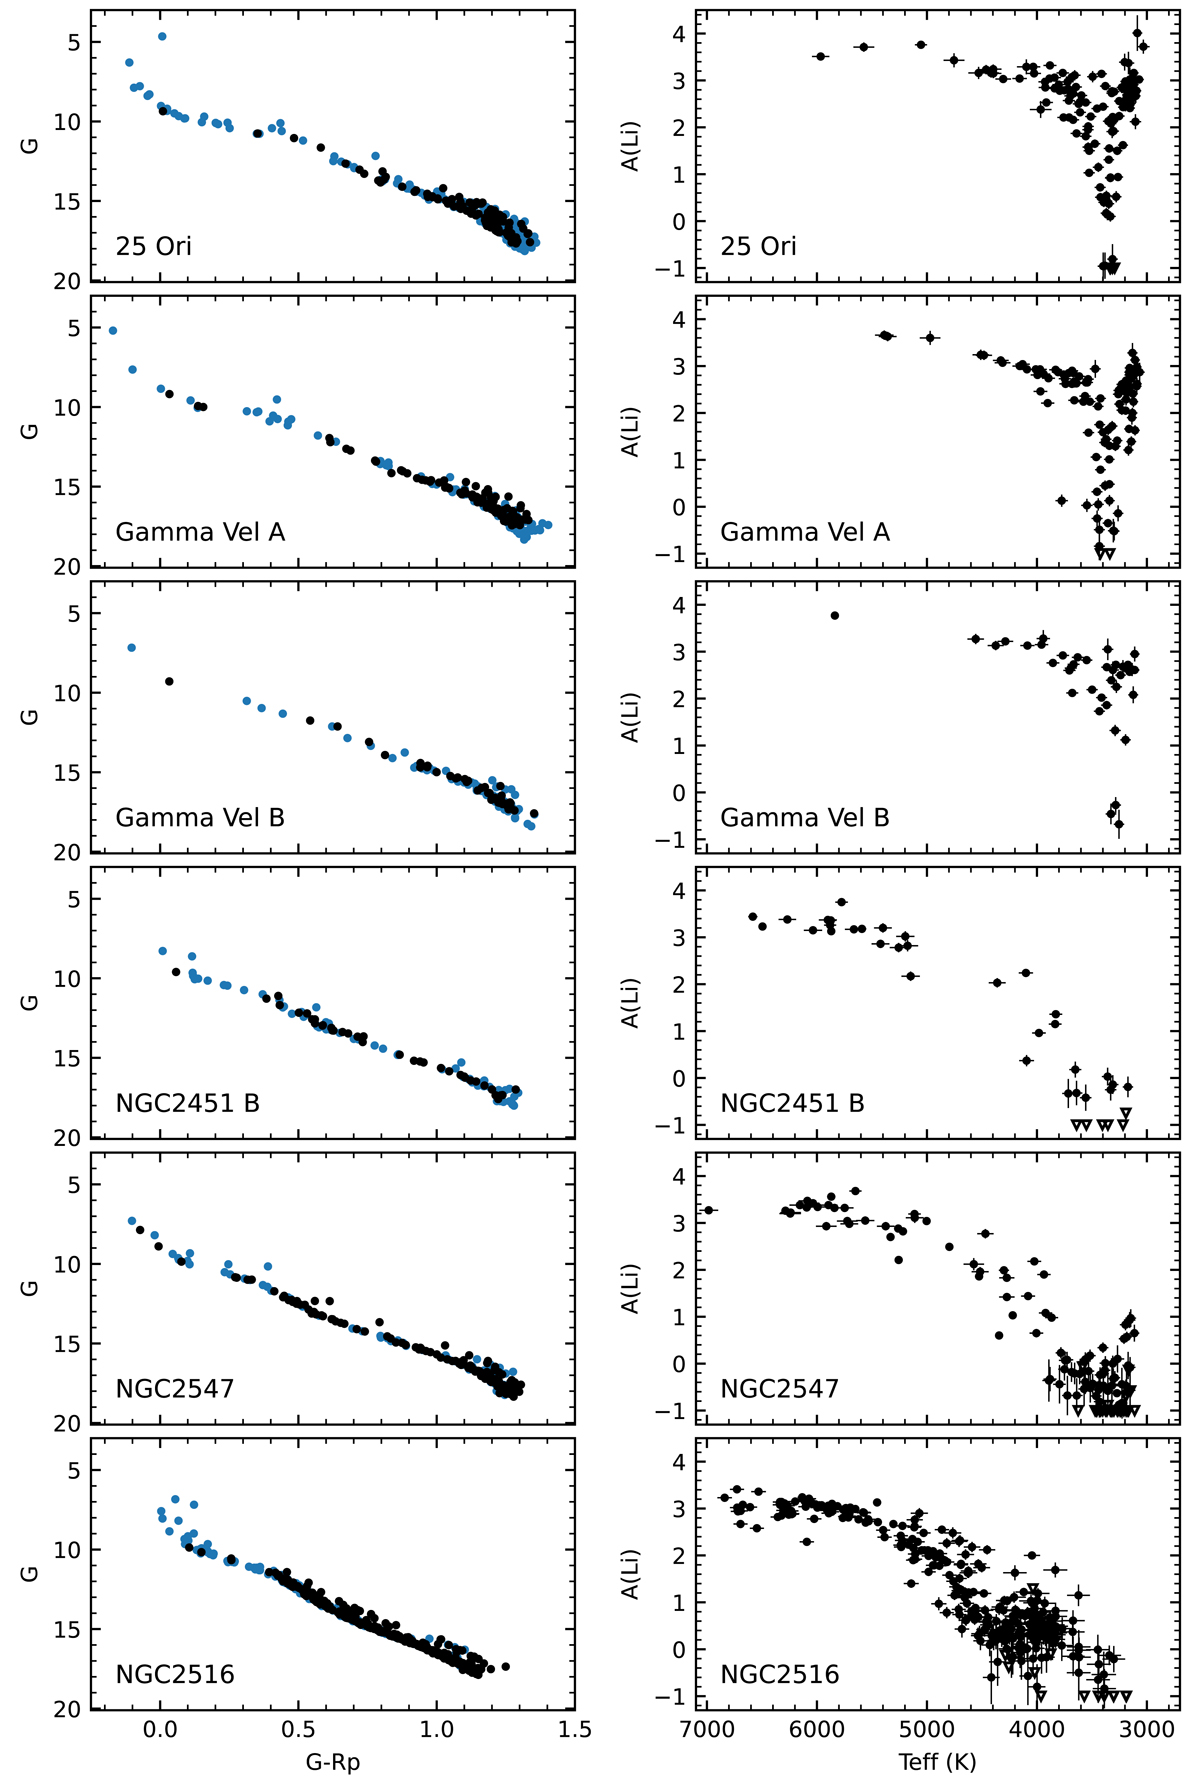
Fig. 3.
Download original image
CMDs (left panels) and lithium distribution as a function of Teff (right panels) of the final samples of selected members for each cluster. The GES and Gaia members are indicated by black and blue dots, respectively. Left panels: only stars with good photometry are plotted. The errors on photometry are smaller than the symbol size. Downward triangles in the lithium diagrams indicate upper limits.
Current usage metrics show cumulative count of Article Views (full-text article views including HTML views, PDF and ePub downloads, according to the available data) and Abstracts Views on Vision4Press platform.
Data correspond to usage on the plateform after 2015. The current usage metrics is available 48-96 hours after online publication and is updated daily on week days.
Initial download of the metrics may take a while.