Fig. 2.
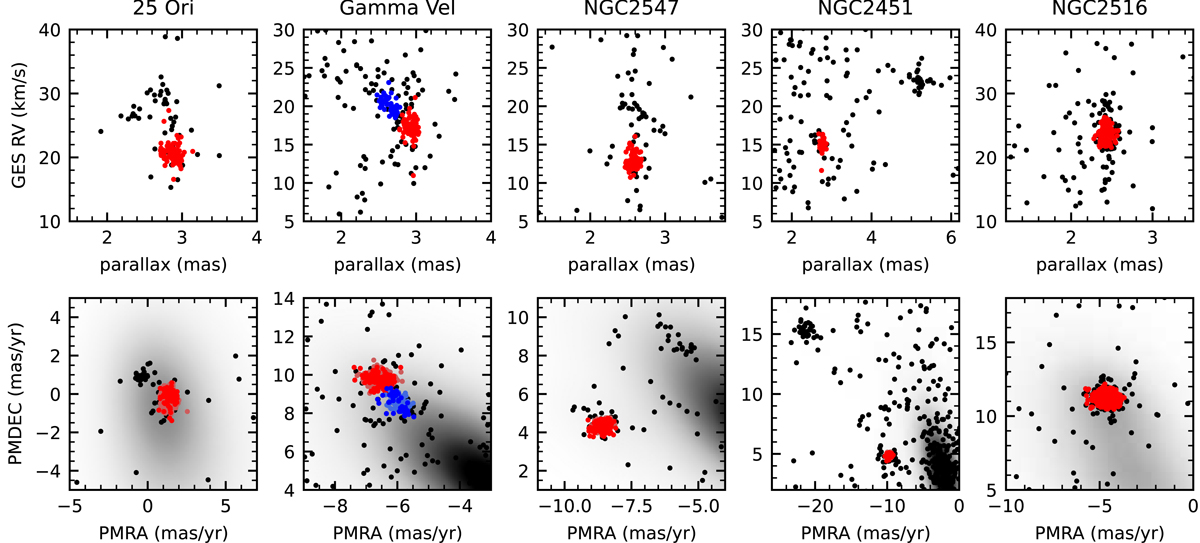
Download original image
GES RV versus parallax (top panels) and proper motion diagrams (bottom panels) for the GES samples for the five clusters after the gravity selection (black dots). In the proper motion diagrams we also plot the density map of the full Gaia samples on a grey scale. The final samples of selected GES and Gaia members are overplotted as red and light red dots, respectively, for 25 Ori, Gamma Vel A, NGC 2451 B, NGC 2547 and NGC 2516, and as blue and light blue dots, respectively, for Gamma Vel B.
Current usage metrics show cumulative count of Article Views (full-text article views including HTML views, PDF and ePub downloads, according to the available data) and Abstracts Views on Vision4Press platform.
Data correspond to usage on the plateform after 2015. The current usage metrics is available 48-96 hours after online publication and is updated daily on week days.
Initial download of the metrics may take a while.