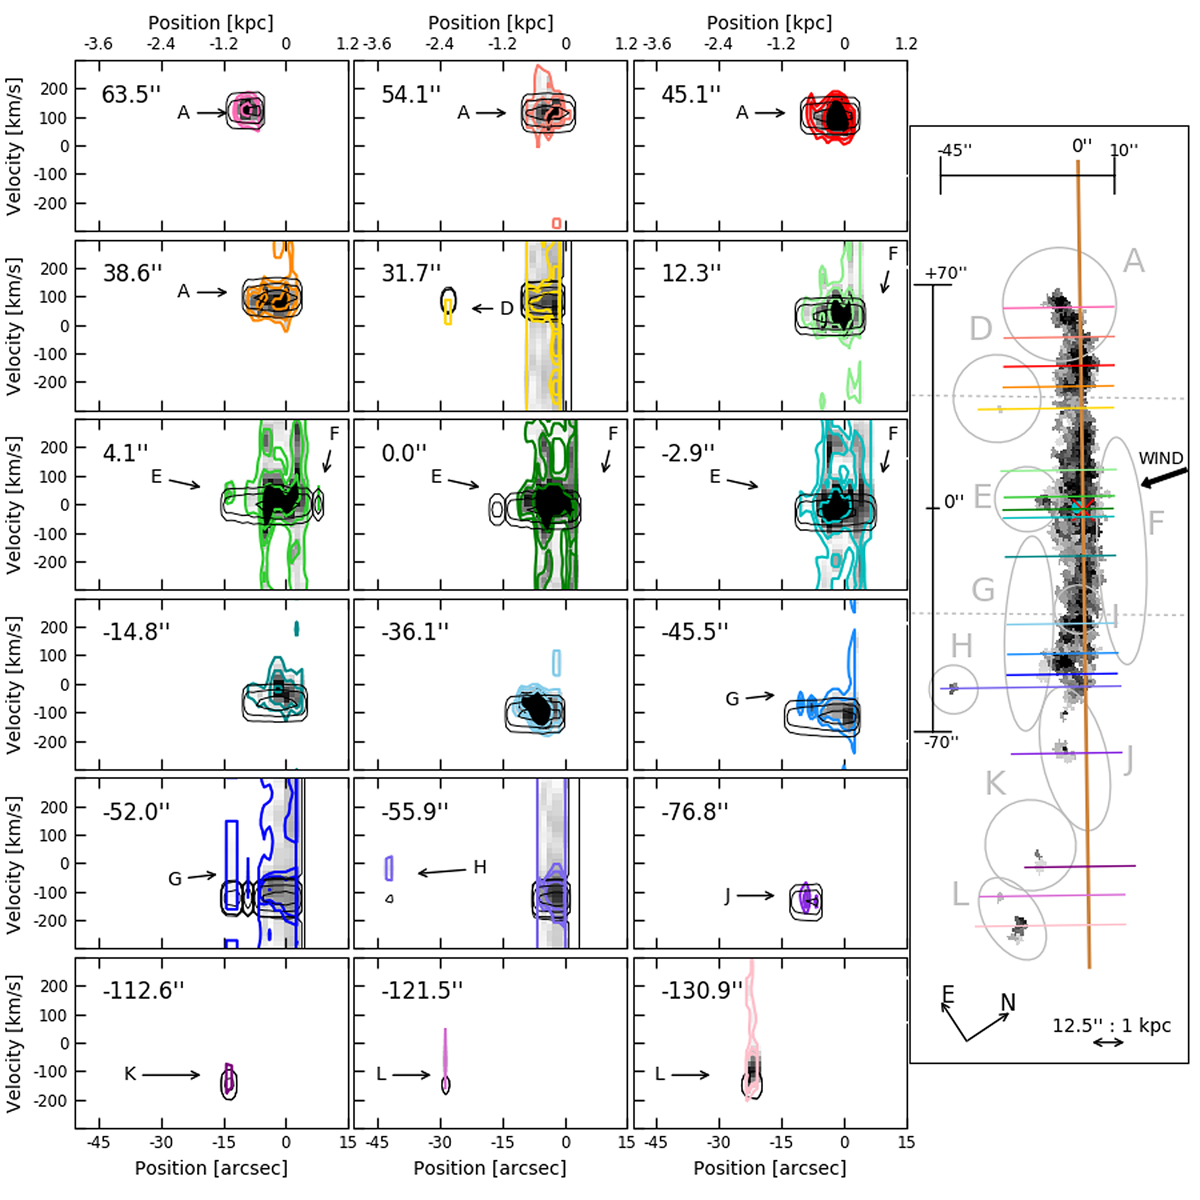
Fig. 9.
Download original image
PVDs parallel to the kinematic minor axis obtained from the PUMA dataset. The locations of the pseudo-slits are in the upper-left corner of each panel, and they are traced on the Hα monochromatic map in the left panel with colour correspondence. The distance increases from the south to the north of the disc, with zero at the kinematic centre. The black dotted ellipse on the Hα monochromatic map indicates the i-band μe(i) = 23 mag arcsec2 isophote. The intensity of the contour levels is 1.3, 1.4, and 1.6 σ from −45.5 to +63 arcsec (∼−3.6 to 5 kpc) and 1, 1.1, and 1.25σ from −130.9 to −52 arcsec (∼−10.5 to −4.2 kpc). The PVDs extracted from the data cube model (black contours) are at 1, 10, and 50% of the maximum intensity of the model.
Current usage metrics show cumulative count of Article Views (full-text article views including HTML views, PDF and ePub downloads, according to the available data) and Abstracts Views on Vision4Press platform.
Data correspond to usage on the plateform after 2015. The current usage metrics is available 48-96 hours after online publication and is updated daily on week days.
Initial download of the metrics may take a while.