Fig. 8.
Download original image
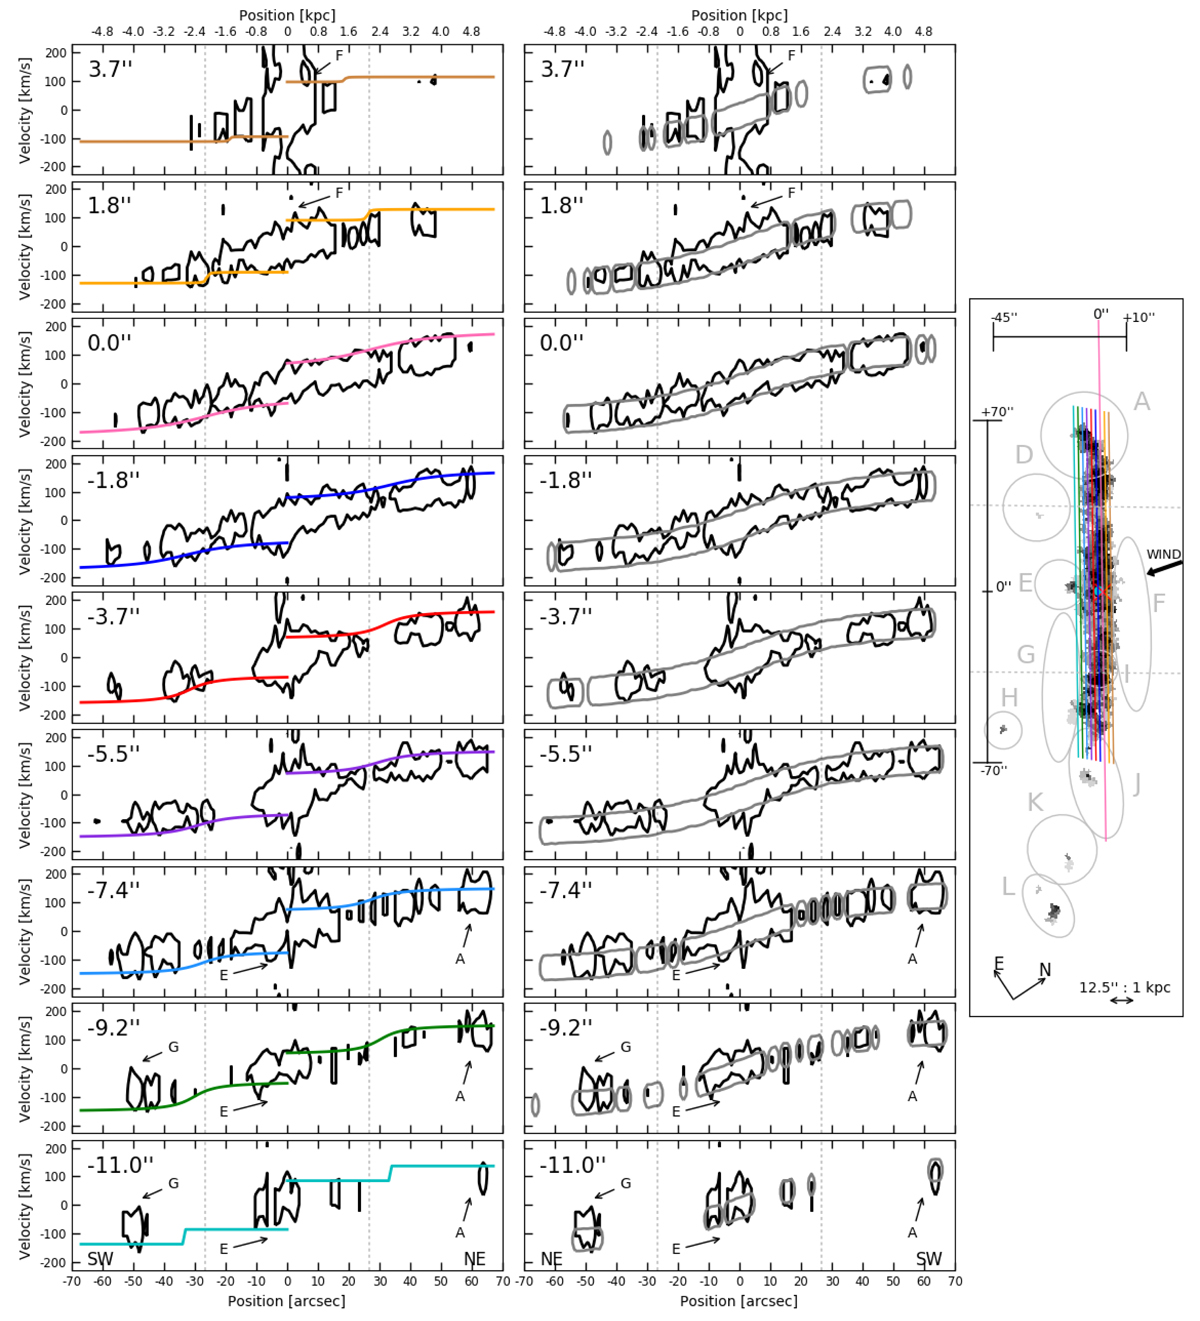
PVDs parallel to the kinematic major axis extracted from the PUMA dataset. The distance of the pseudo-slit from the disc plane along the z axis (positive to the north) is given in the upper-left corner of each panel. The positions of all the pseudo-slits are shown on the Hα monochromatic map in the right panel. From the top at +3.7 to −5.5 arcsec (from ∼0.3 to ∼0.4 kpc), the intensity of the contour level is at 1.5 σ, and from −7.4 to −11 arcsec (from ∼0.6 to ∼0.9 kpc) the intensity level is at 1.2σ. In the left panels, coloured lines overlaid on the PVD represent the best fit of the terminal velocity (Relation (B.3) with η = 0.3) according to the arc-tangent model (Eq. (B.4)). There is a correspondence in colour between the terminal velocities and the pseudo-slits plotted on the monochromatic map in the right panel. In the middle panels, the PVDs derived from the data cube model, which was built in the context of the ITM to compute the RC (see Appendix B.4), are overlaid on the observed PVD in grey. All the PVDs extracted from the data cube model are at 8% of the maximum intensity of the model. The two parallel dashed lines are at r0 = ±30 arcsec (±2.4 kpc) and indicate the three main disc regions: north-east, central, and south-west. The different features of interest are indicated with letters A to H.
Current usage metrics show cumulative count of Article Views (full-text article views including HTML views, PDF and ePub downloads, according to the available data) and Abstracts Views on Vision4Press platform.
Data correspond to usage on the plateform after 2015. The current usage metrics is available 48-96 hours after online publication and is updated daily on week days.
Initial download of the metrics may take a while.