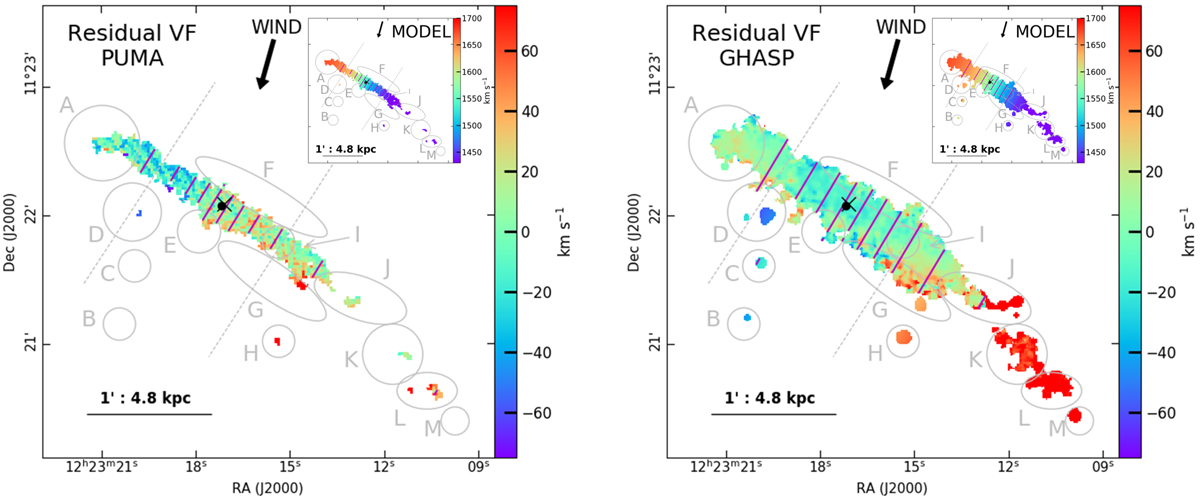
Fig. 7.
Download original image
Residual velocity fields obtained after subtracting the velocity field computed from the ITM model data cube (left PUMA, right GHASP). The model, based on a solid-body rotation, is shown in the inset. The purple parallel lines show the isovelocity contours of the edge-on rotating disc model. The bullet and the cross indicate the position of the photometric and kinematical centre, respectively. The arrow indicates the wind direction as derived from the models of Vollmer et al. (2012, 2021).
Current usage metrics show cumulative count of Article Views (full-text article views including HTML views, PDF and ePub downloads, according to the available data) and Abstracts Views on Vision4Press platform.
Data correspond to usage on the plateform after 2015. The current usage metrics is available 48-96 hours after online publication and is updated daily on week days.
Initial download of the metrics may take a while.