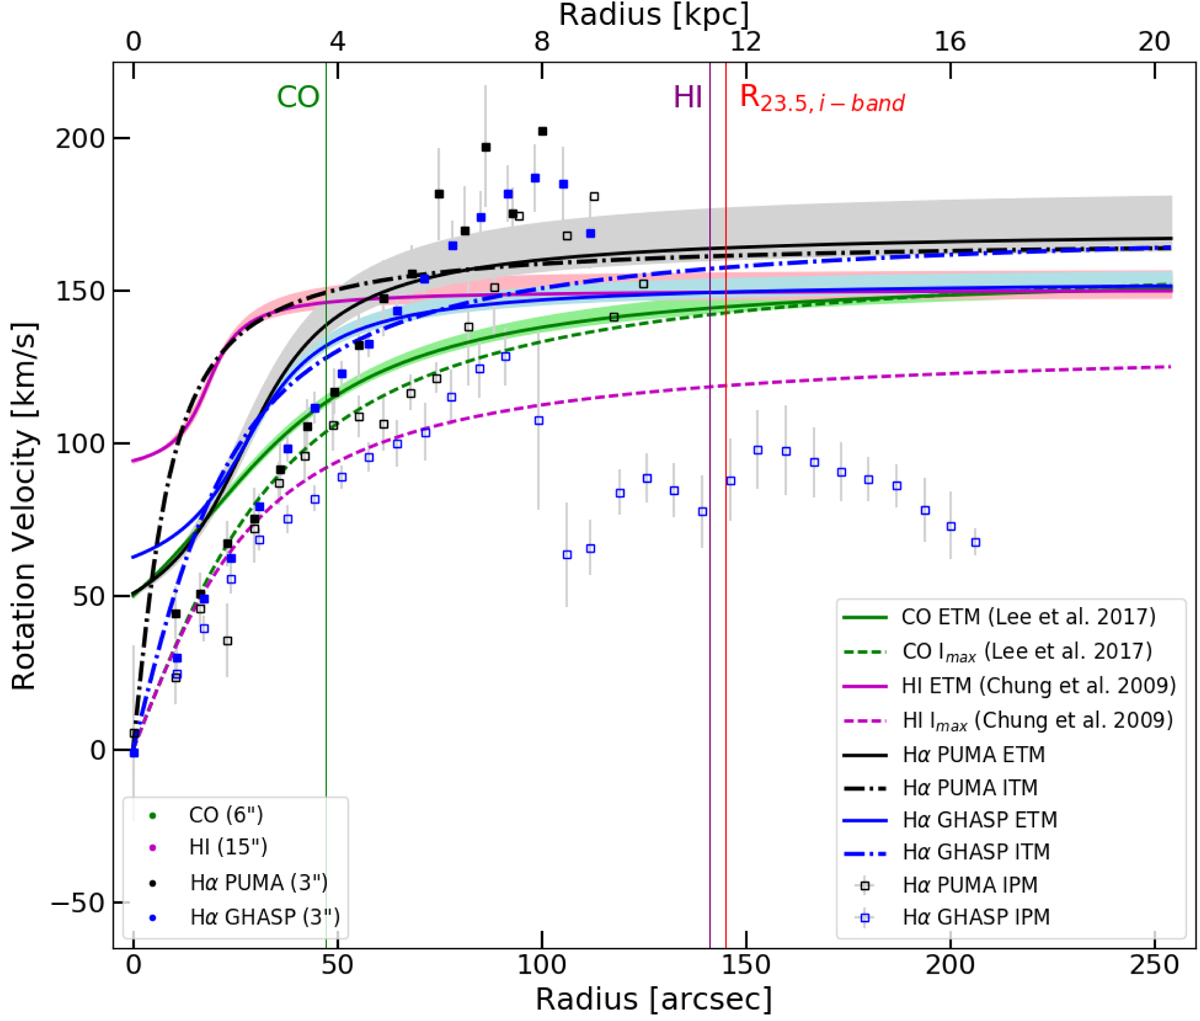
Fig. 4.
Download original image
RCs of NGC 4330 derived using the 12CO(2 − 1) at λ = 1.3 mm data from Lee et al. (2017) (green), the HI (λ = 21 cm) data from Chung et al. (2009) (purple), and the FP Hα data from PUMA (black) and GHASP (blue). The RCs from CO and HI data were computed using the ETM. The solid lines correspond to the best fit to the points of the terminal velocity using η = 0.3, and the shaded areas show the rotation velocity amplitude for η = [0.2, 0.5] (see relation (B.3)); the dashed lines show the RC computed from the PVD maximum intensity. For comparison, the Hα RCs shown in Fig. 3 are also reported on this plot. The green, purple, and red vertical lines indicate the CO extension (∼47 arcsec, ∼3.8 kpc), the HI radius (∼141 arcsec, ∼11.3 kpc), and the outermost photometric radius (R23.5 ∼ 145 arcsec, ∼11.6 kpc), respectively. The top-right insert indicates the angular resolution of each dataset.
Current usage metrics show cumulative count of Article Views (full-text article views including HTML views, PDF and ePub downloads, according to the available data) and Abstracts Views on Vision4Press platform.
Data correspond to usage on the plateform after 2015. The current usage metrics is available 48-96 hours after online publication and is updated daily on week days.
Initial download of the metrics may take a while.