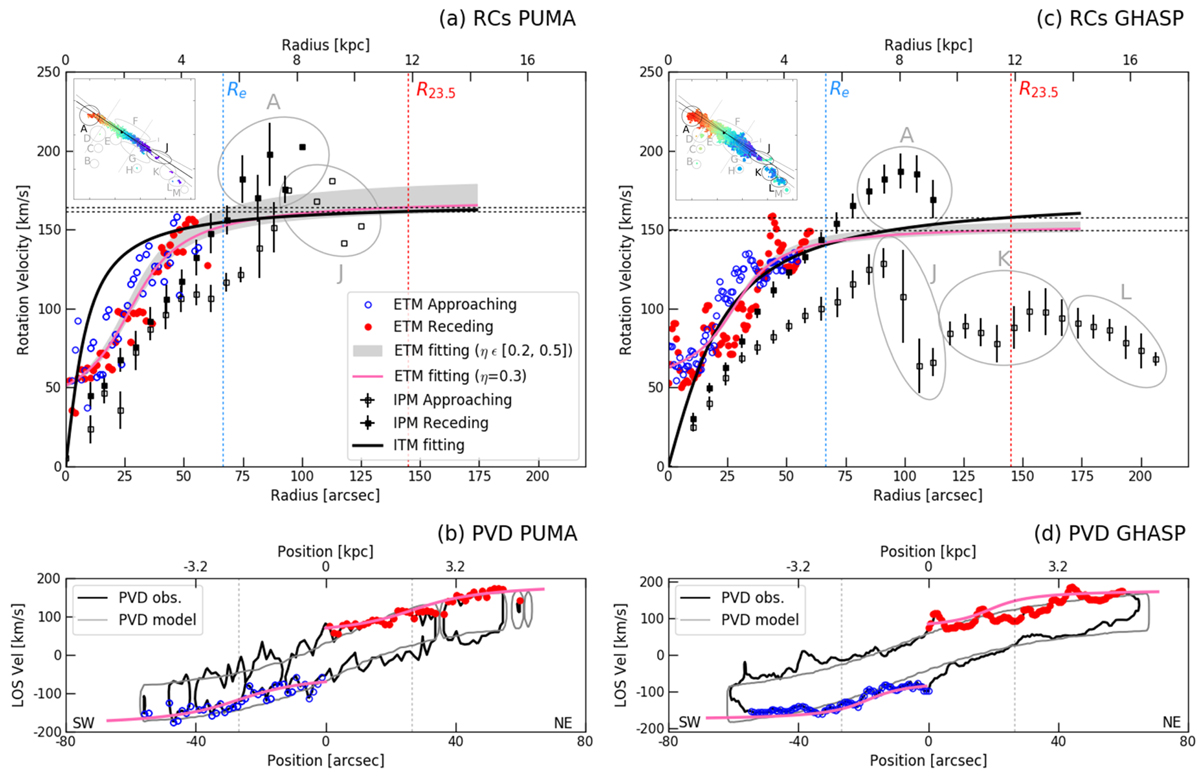
Fig. 3.
Download original image
PUMA (panels a and b) and GHASP (panels c and d) RCs (panels a and c) and PVDs (panels b and d) of NGC 4330. Panels a,c: RCs derived using three different methods: the IPM, the ETM, and the ITM (see Appendix B.3 for a further explanation on the methodology). In the case of the IPM (black squares), an azimuthal sector of ±5° in the sky plane has been taken around the major axis to compute the rotation velocities; filled and empty black squares indicate the receding and the approaching sides, respectively. The upper-left insert shows the azimuthal sector and the location of the regions pointed on the RC. For the ETM, the rotation velocities have been derived from the PVD along the major axis (z = 0), shown in panels b and d. The terminal velocities are represented by empty blue circles for the receding side and filled red circles for the approaching side; the pink line corresponds to the best fit to these points using η = 0.3, and the shaded area shows the rotation velocity amplitude for η = [0.2, 0.5] (see relation (B.3)). The ITM based on a cylindrical model (described in Appendix B.4) is represented by the black line. Panels b,d: PVDs showing the LoS velocities computed with the ETM from which the rotation velocities are computed in the upper panels. On top of the PVD, the filled red and open blue circles indicate the extremal LoS velocities and the pink curve the arctan model fitting those velocities. The red and blue vertical dotted lines in panels a and c show the photometric and effective radius, and the grey dotted lines in the lowest panels show the position of r0 (see Sect. 4).
Current usage metrics show cumulative count of Article Views (full-text article views including HTML views, PDF and ePub downloads, according to the available data) and Abstracts Views on Vision4Press platform.
Data correspond to usage on the plateform after 2015. The current usage metrics is available 48-96 hours after online publication and is updated daily on week days.
Initial download of the metrics may take a while.