Fig. 2.
Download original image
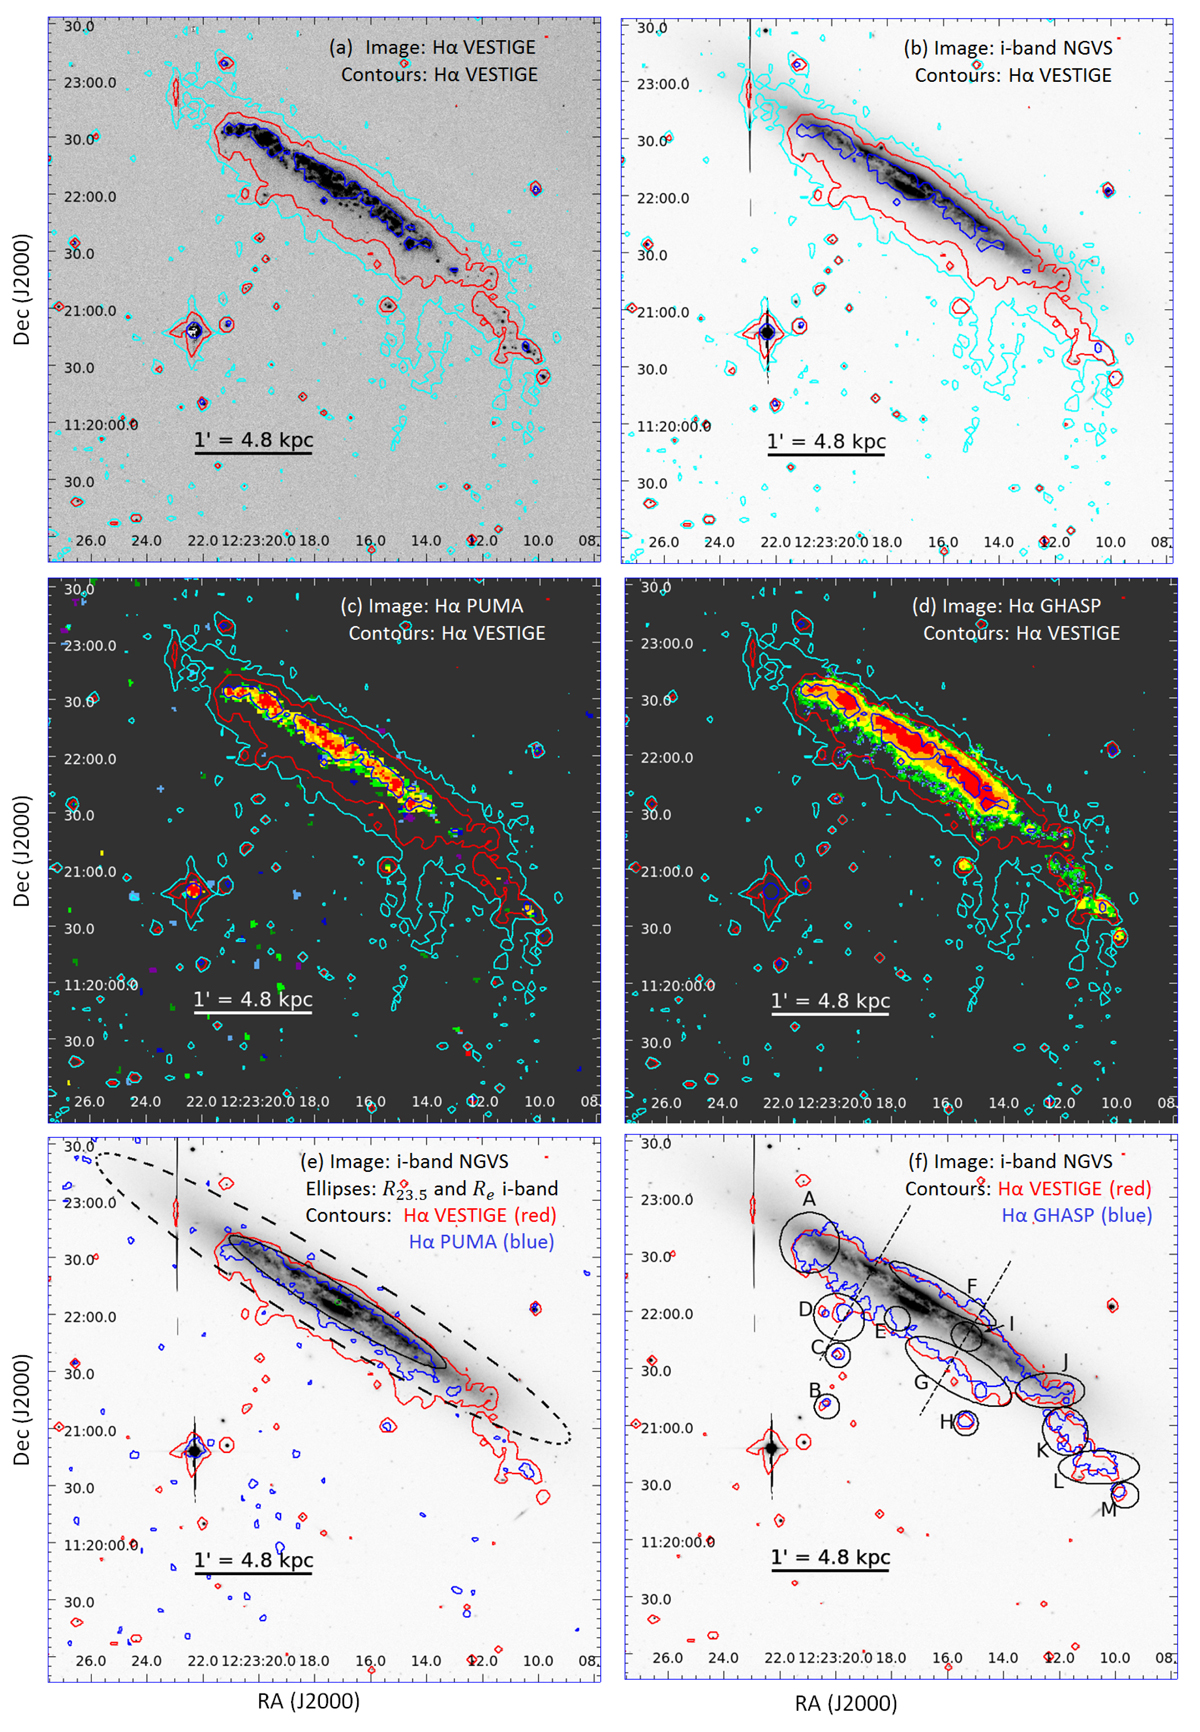
Images of NGC 4330. Panel a: full resolution VESTIGE continuum-subtracted Hα narrow-band image of NGC 4330 in linear scale. Panel b: NGVS i-band image. Panels c,d: PUMA and GHASP FP Hα monochromatic images, respectively. Panel e: NGVS i-band image. The dashed black ellipse and the inner ellipse indicate the surface brightness, μ(i) = 23.5, and the effective surface brightness, μe(i) = 21.5 mag arcsec−2, respectively, and the green bullet indicates the photometric centre (see Fig. 1). Panel f: NGVS i-band image with marks on the zones of interest labelled by letters (A to M) and two parallel dashed lines at r0 ∼ 30 arcsec (∼2.4 kpc), which divide the galactic disc into three main regions: north-eastern, central, and south-western (see Sect. 4). The cyan, red, and blue contours in panels a to d show the VESTIGE surface brightness Σ(Hα) = 0.3, 1.0, and 12.5 × 10⁻¹⁷ erg s−1 cm−2 arcsec−2, respectively. The red contours from panels e and f show the VESTIGE surface brightness Σ(Hα) = 10−17 erg s−1 cm−2 arcsec−2. The blue contours in panel e indicate the surface brightness limit of PUMA, Σ(Hα)∼3.5 × 10⁻¹⁷ erg s−1 cm−2 arcsec−2, while those in panel f show the surface brightness limit of GHASP, Σ(Hα)∼10−17 erg s−1 cm−2 arcsec−2.
Current usage metrics show cumulative count of Article Views (full-text article views including HTML views, PDF and ePub downloads, according to the available data) and Abstracts Views on Vision4Press platform.
Data correspond to usage on the plateform after 2015. The current usage metrics is available 48-96 hours after online publication and is updated daily on week days.
Initial download of the metrics may take a while.