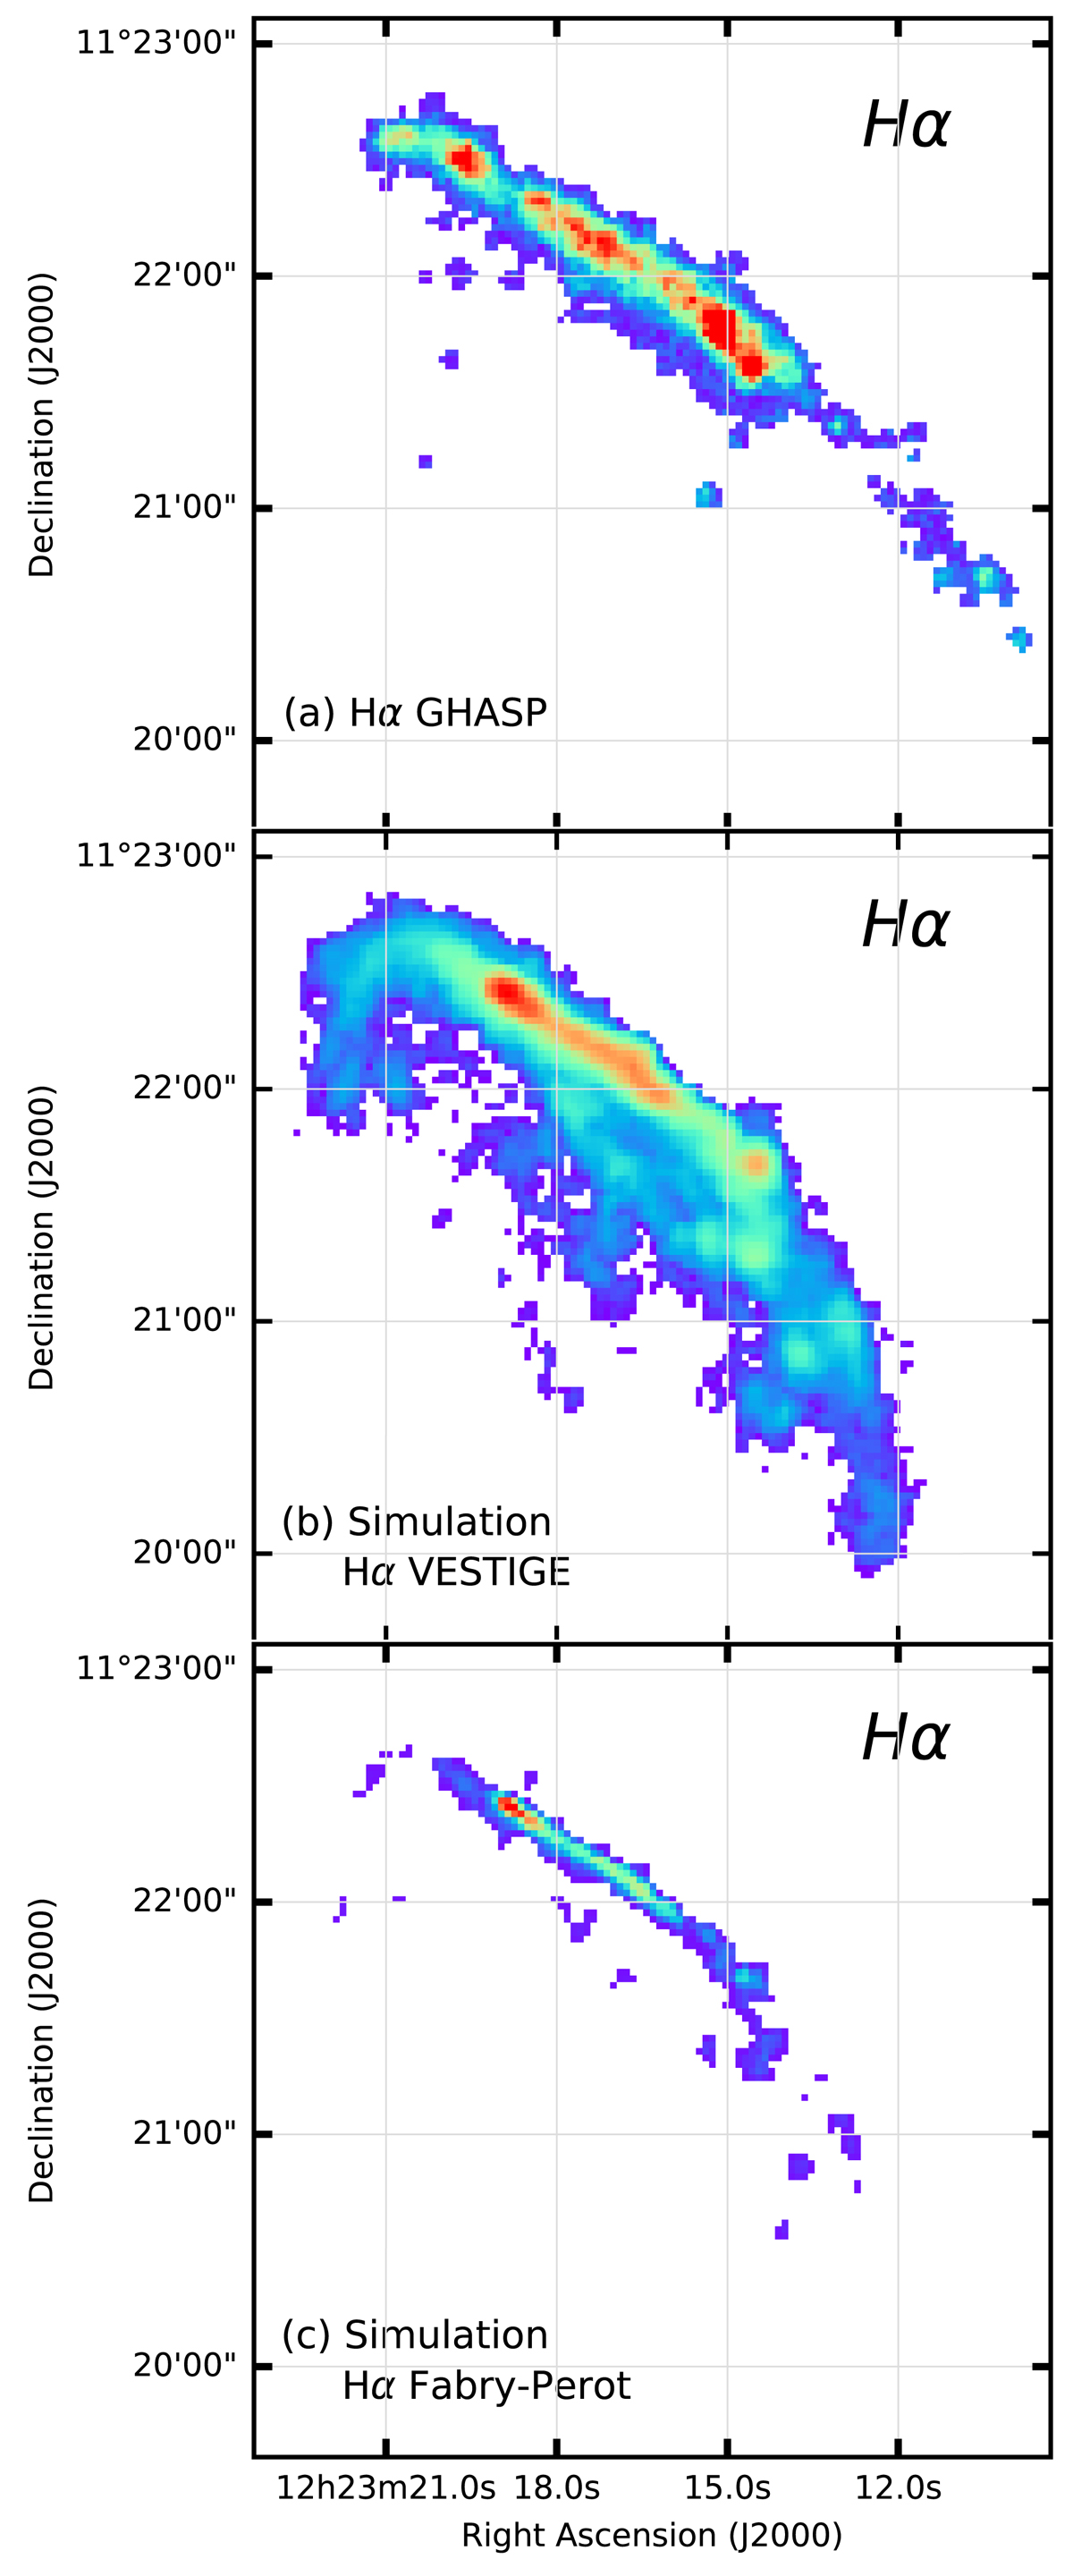
Fig. C.8.
Download original image
GHASP (panel (a)) and simulated Hα surface brightness (panels (b) and (c)) of NGC 4330, with scales identical to those used in Fig. 2 (d), i.e. with a threshold limit Σ(Hα) ≃ 10−17 erg s−1 cm−2 arcsec−2. The low level cuts used to display the simulated Hα images have been chosen to show the low column density ionised gas reached by the simulations (panel (b)) and at higher surface brightness levels (Σ(Hα) ≃ 2×10⁻¹⁷ erg s−1 cm−2 arcsec−2; panel (c)), matching the typical surface brightness limit of VESTIGE and FP observations, respectively.
Current usage metrics show cumulative count of Article Views (full-text article views including HTML views, PDF and ePub downloads, according to the available data) and Abstracts Views on Vision4Press platform.
Data correspond to usage on the plateform after 2015. The current usage metrics is available 48-96 hours after online publication and is updated daily on week days.
Initial download of the metrics may take a while.