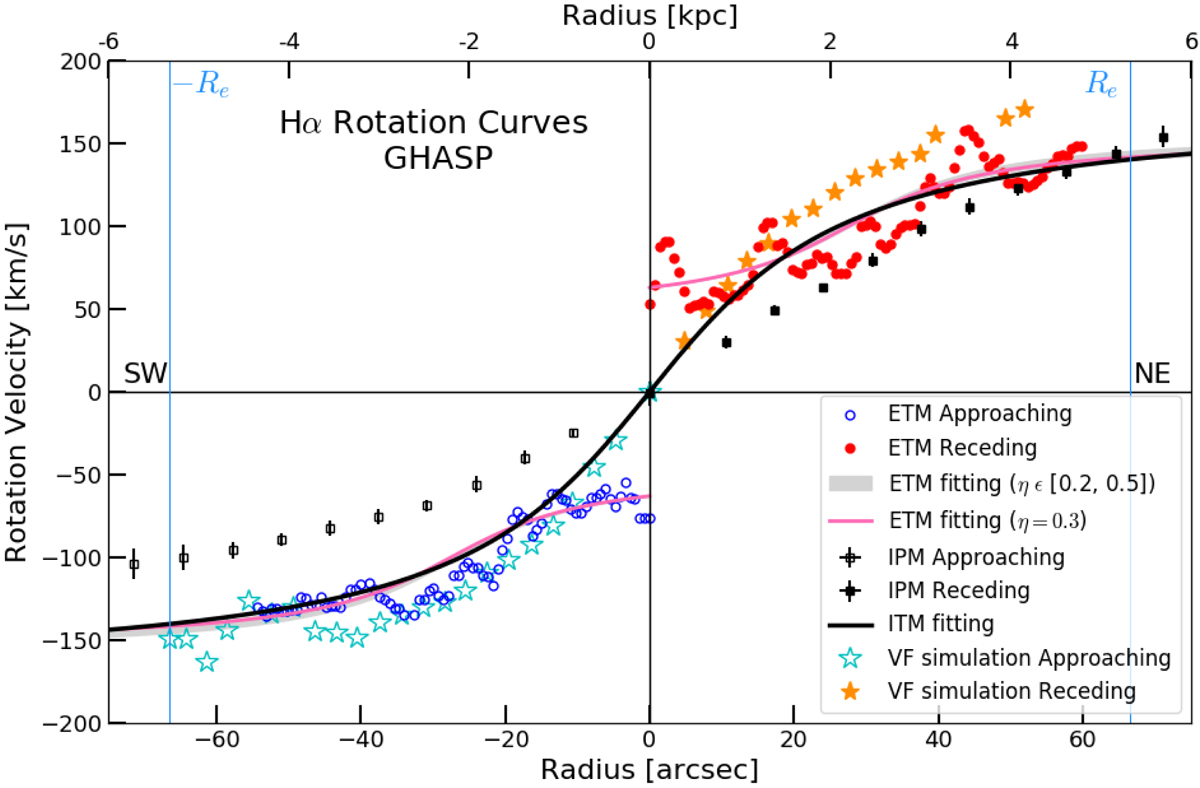
Fig. C.7.
Download original image
Comparison between observed and simulated unfolded RCs. The simulated velocity field shown in panel (c) of Fig. 11 has been used to measure the RC along the major axis of the galaxy; the receding and approaching sides are respectively represented by filled orange and opened cyan stars (⋆) and superimposed onto the GHASP observed and modelled RCs already displayed in panel (c) of Fig. 3, using the same symbols, colours, and lines. The blue vertical lines indicate the position of the effective radius.
Current usage metrics show cumulative count of Article Views (full-text article views including HTML views, PDF and ePub downloads, according to the available data) and Abstracts Views on Vision4Press platform.
Data correspond to usage on the plateform after 2015. The current usage metrics is available 48-96 hours after online publication and is updated daily on week days.
Initial download of the metrics may take a while.