Fig. C.4.
Download original image
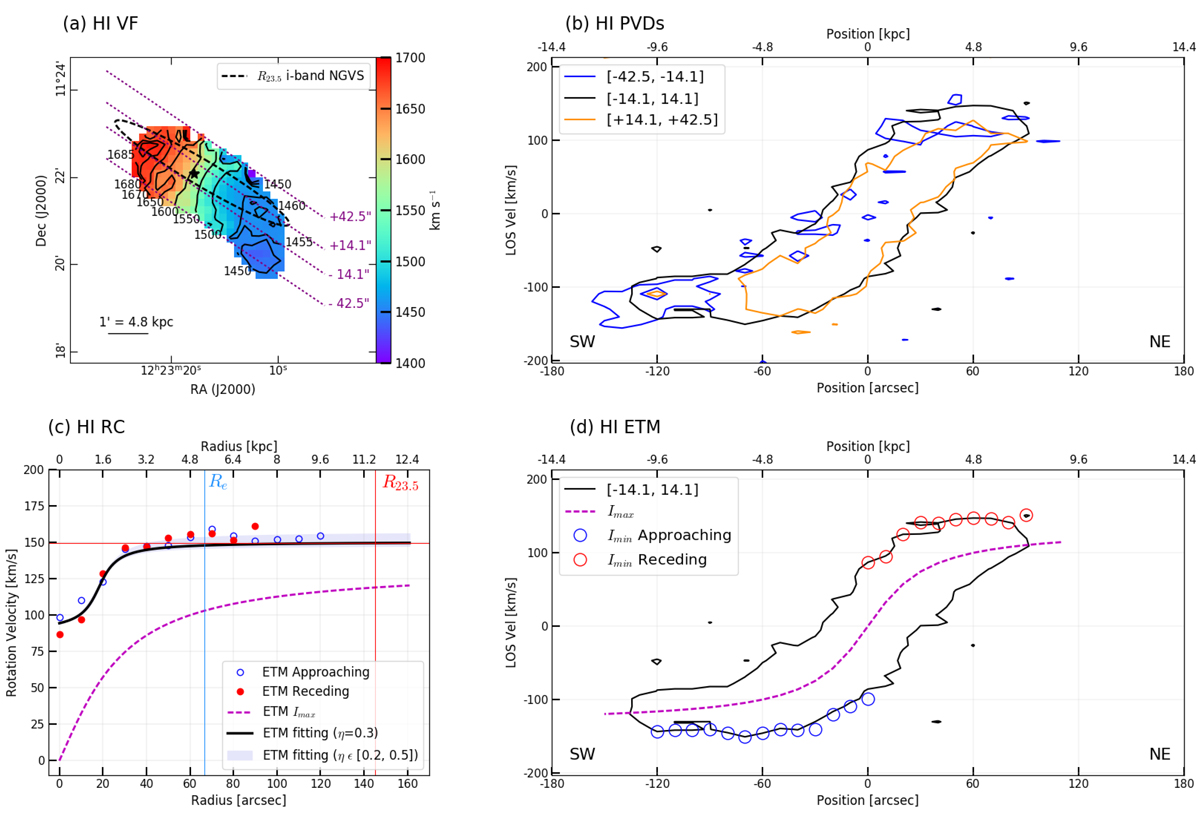
HI emission data of NGC 4330 from Chung et al. (2009). Panel (a): Cold gas velocity field on which the positions of pseudo-slits are superimposed (∼28 arcsec wide) parallel to the kinematic major axis and the ellipse fitted to the isophote of surface brightness μ(i) = 23.5 mag arcsec−2 of the NGVS i-band image, which traces the stellar disc. Panels (b) and (d): Outermost contour of the PVDs. Panel (b) corresponds to the three pseudo-slit positions drawn in panel (a), and panel (d) corresponds to the central pseudo-slit position. The red and blue circles indicate the position of the minimum intensity of the receding and approaching side, respectively, while the dashed line indicates the maximum intensity. Both entities are used to estimate the terminal velocity and to compute the RC using the ETM method. Panel (c): RC computed using the ETM, where the terminal velocity is represented by empty blue circles for the receding side and the filled red circles for the approaching side. The black solid line indicates the best fit to these points using η = 0.3, the shaded area shows the rotation velocity amplitude for η = [0.2, 0.5], the purple dashed line indicates the RC computed from the PVD maximum intensity, and the red and blue vertical lines indicate the photometric and effective radius, respectively.
Current usage metrics show cumulative count of Article Views (full-text article views including HTML views, PDF and ePub downloads, according to the available data) and Abstracts Views on Vision4Press platform.
Data correspond to usage on the plateform after 2015. The current usage metrics is available 48-96 hours after online publication and is updated daily on week days.
Initial download of the metrics may take a while.