Fig. C.3.
Download original image
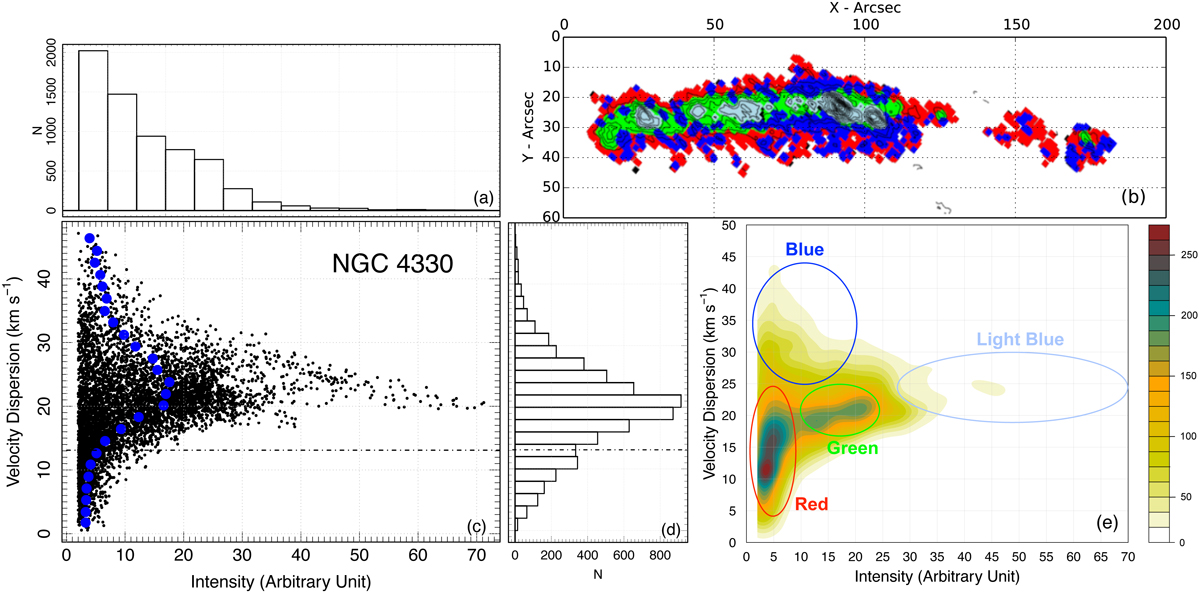
GHASP velocity dispersion properties of NGC 4330. Panel (a): Intensity histogram. Panel (b): Loci, in the galaxy, of the different areas shown in panel (e) with different colours (red, green, blue, and light blue), on top of which Hα isocontours have been superimposed. Panel (c): Velocity dispersion versus emission intensity diagnostic diagram. Each black dot represents a pixel, and the blue dots represent the mean of the intensity in each velocity dispersion bin. Panel (d): Velocity dispersion histogram. Panel (e): Pixel density map of the velocity dispersion versus intensity diagram. The colour bar represents pixel density. The dashed line in plots (c) and (d) represents the LSF σLSF.
Current usage metrics show cumulative count of Article Views (full-text article views including HTML views, PDF and ePub downloads, according to the available data) and Abstracts Views on Vision4Press platform.
Data correspond to usage on the plateform after 2015. The current usage metrics is available 48-96 hours after online publication and is updated daily on week days.
Initial download of the metrics may take a while.