Fig. C.2.
Download original image
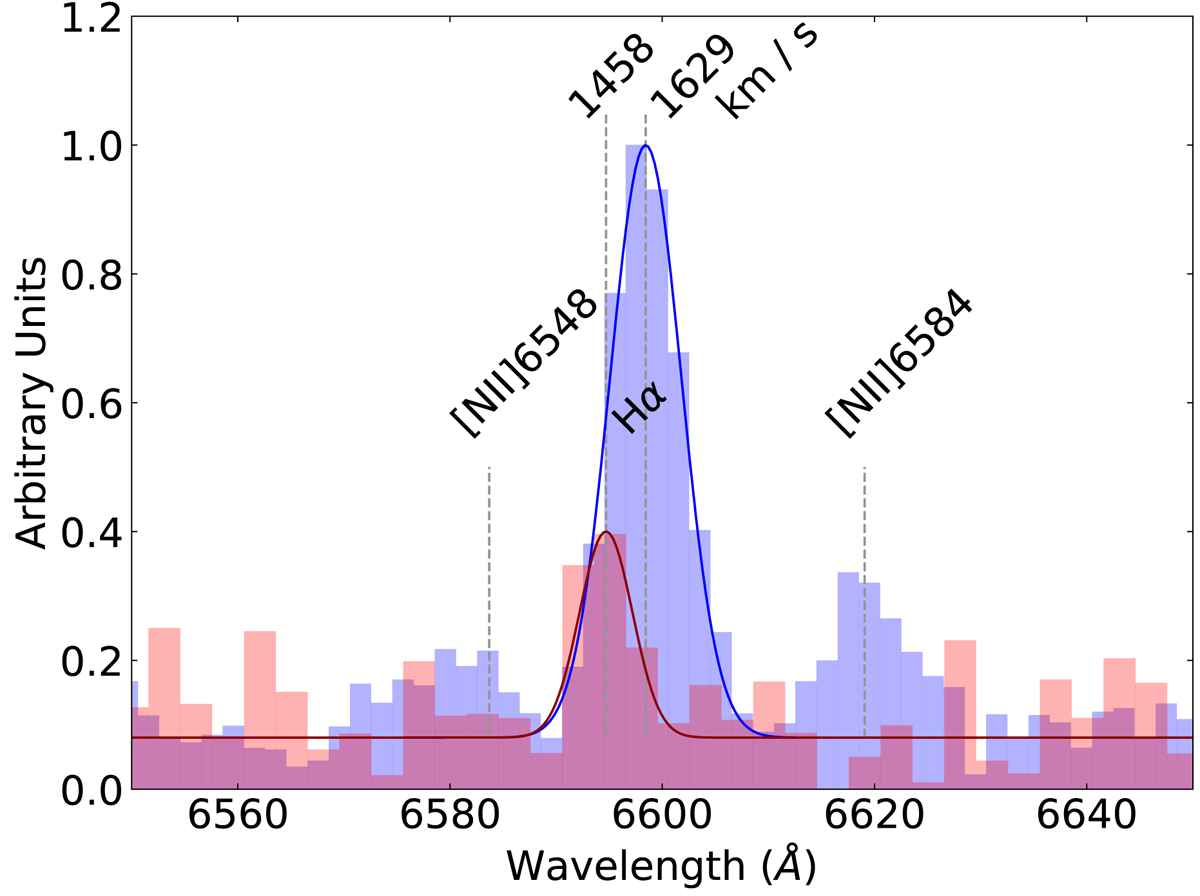
Long-slit spectra obtained with MISTRAL at the 1.93 m OHP telescope. The Hα lines of region D (red spectrum) and the position of the orthogonal projection of region D on the major axis of the galaxy (blue spectrum) are fitted by Gaussian functions, with intensities in normalised units. The two vertical dashed lines on Hα indicate the measured velocity of region D (1458±46 km s−1) and on the disc (1629±46 km s−1).
Current usage metrics show cumulative count of Article Views (full-text article views including HTML views, PDF and ePub downloads, according to the available data) and Abstracts Views on Vision4Press platform.
Data correspond to usage on the plateform after 2015. The current usage metrics is available 48-96 hours after online publication and is updated daily on week days.
Initial download of the metrics may take a while.