Fig. C.1.
Download original image
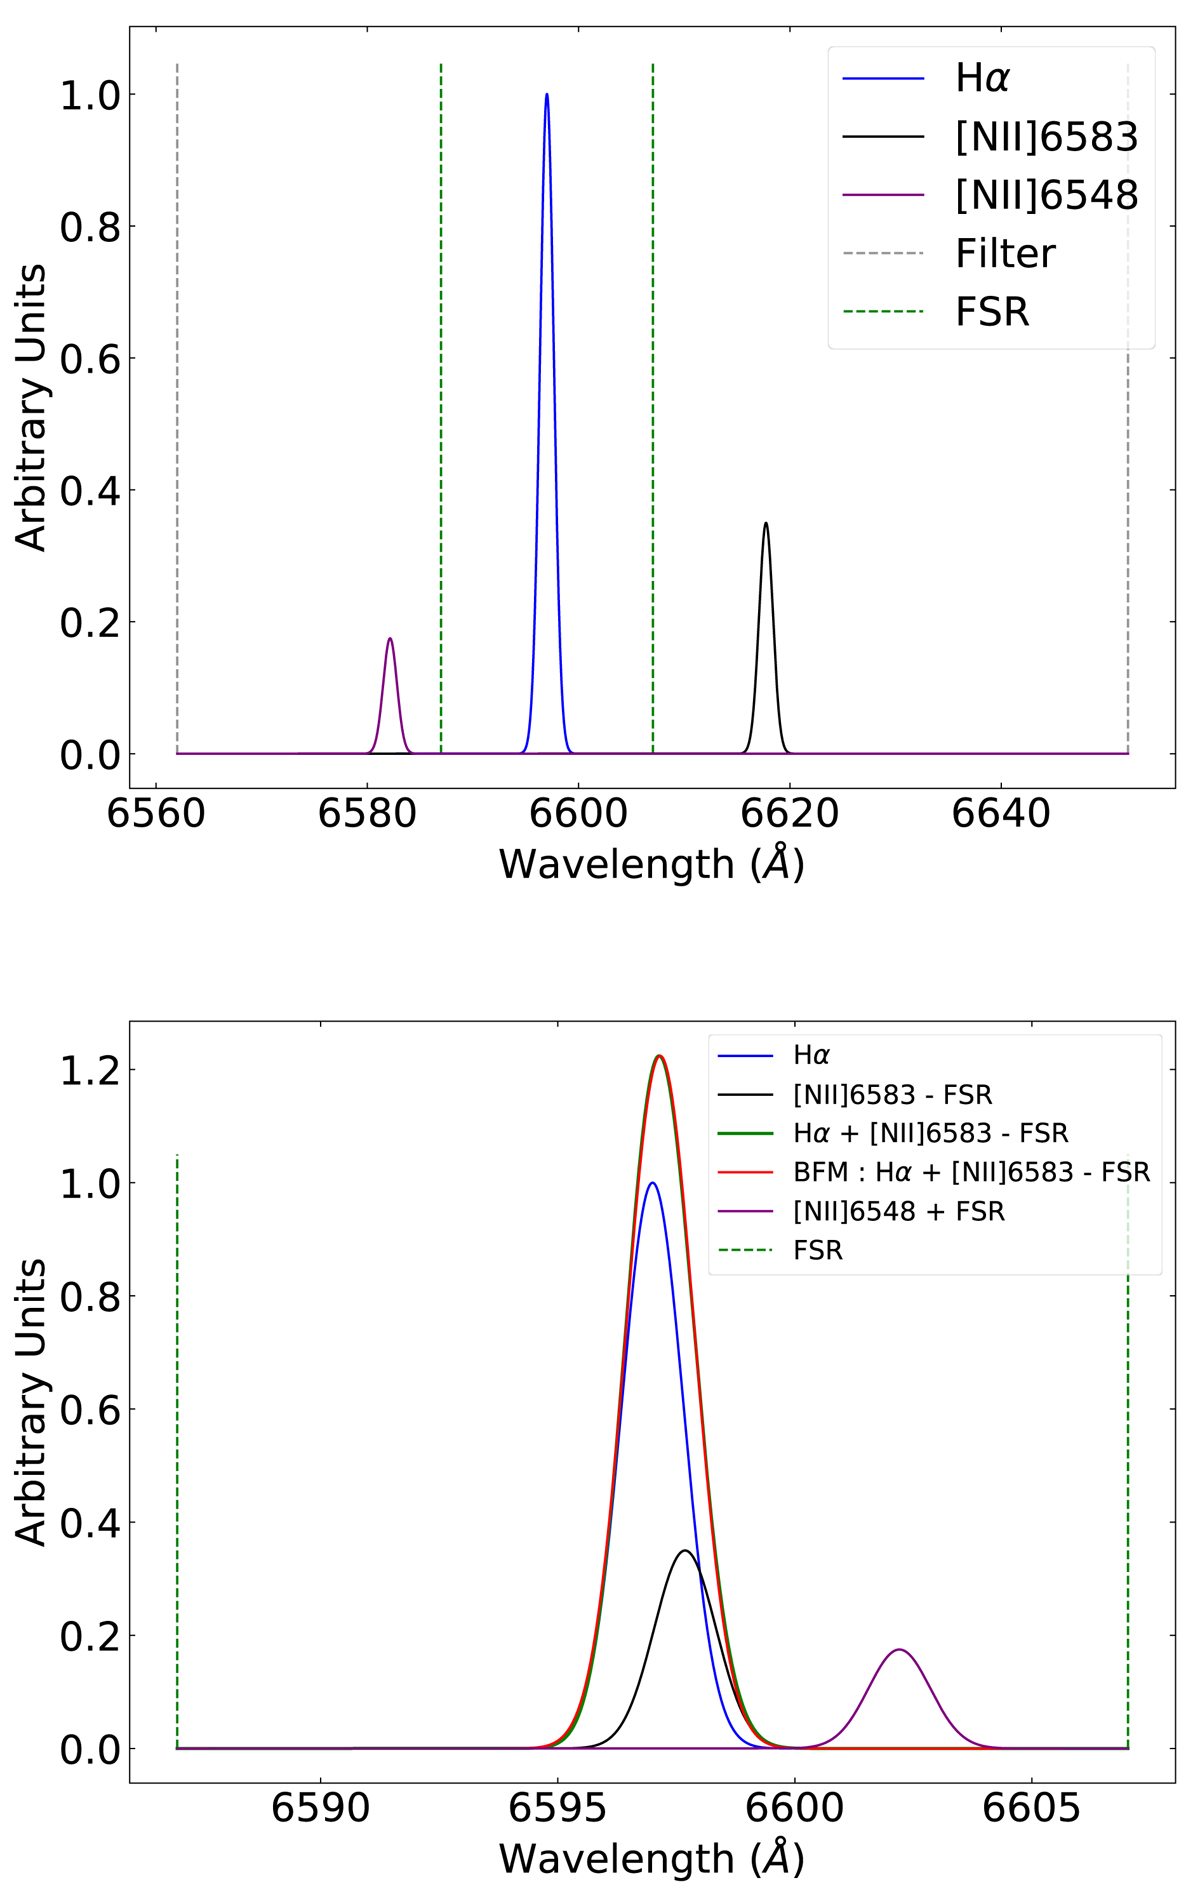
Model of the PUMA spectrum. The Hα plus the two [NII]6548, 6583 lines, transmitted by the filter, are represented by Gaussian functions of width σLSF (see Table 1). Normalised units to the Hα line are used for the y axis. The relative intensity between the Hα and the [NII] lines are given in Sect. A.1. The distance between the two green dashed vertical lines represents the FSR ( ∼ 20 Å). Top panel: Redshifted Hα and [NII]6548, 6583 lines are located at their right position. The distance between the two grey dashed vertical lines represents the filter width (FWHM ∼ 90 Å). Bottom panel: Redshifted lines located at their apparent position due to the FSR recovering. The [NII]6548 line is shifted by plus one FSR, and the [NII]6583 is shifted by minus one FSR. The green curve represents the sum of the Hα plus [NII]6583 lines, whereas the red one represents the Gaussian that best fits the sum of the two lines (best fit method).
Current usage metrics show cumulative count of Article Views (full-text article views including HTML views, PDF and ePub downloads, according to the available data) and Abstracts Views on Vision4Press platform.
Data correspond to usage on the plateform after 2015. The current usage metrics is available 48-96 hours after online publication and is updated daily on week days.
Initial download of the metrics may take a while.