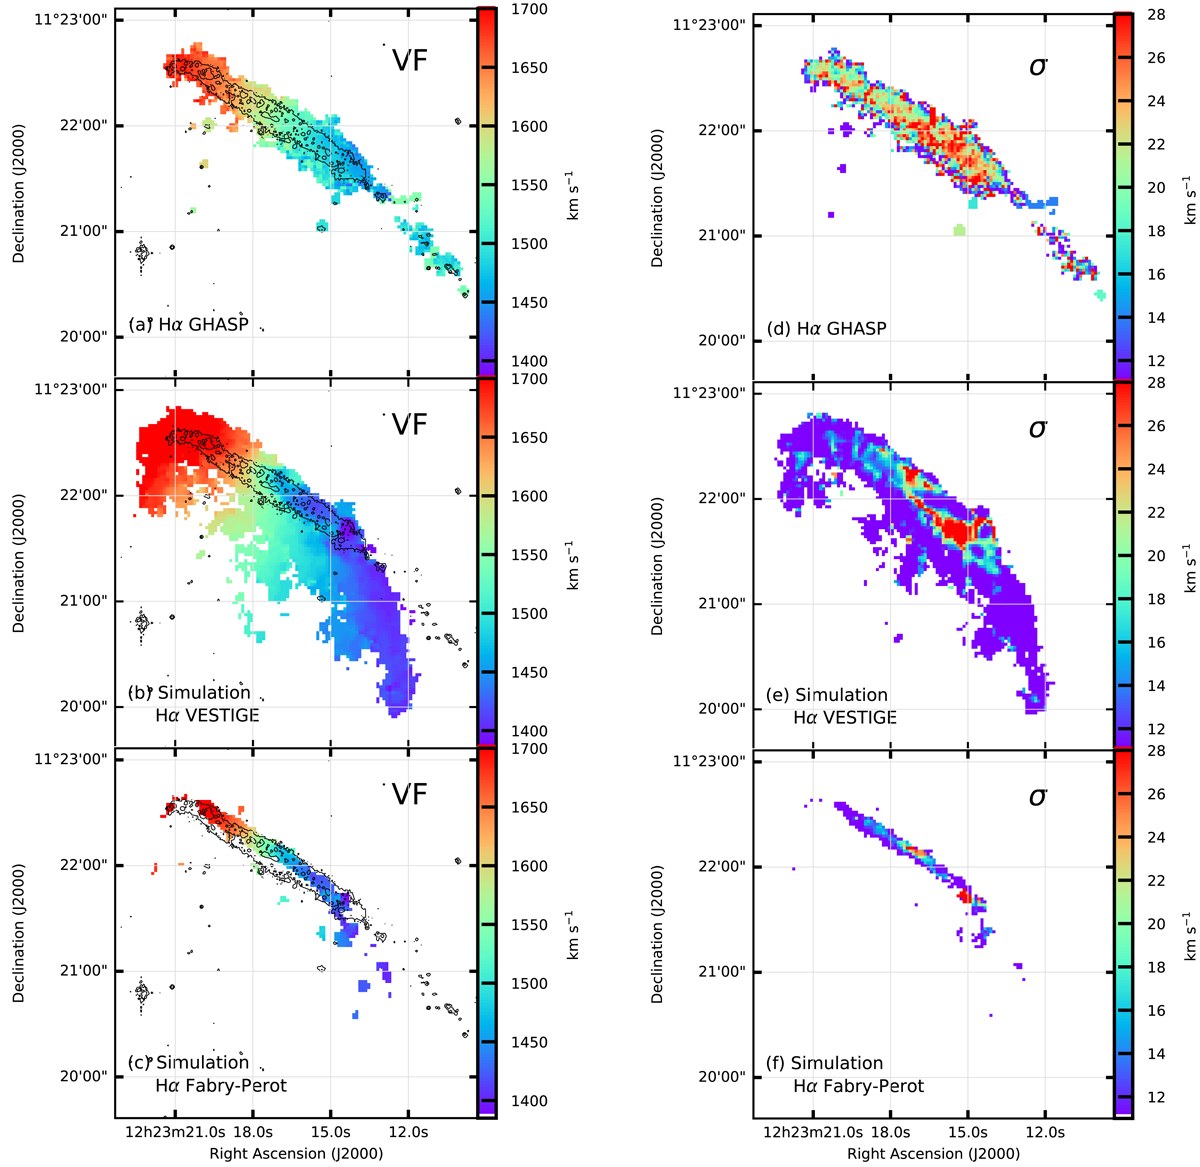
Fig. 11.
Download original image
GHASP (panels a and d) and simulated (panels b, c, e and f) Hα velocity (left column) and velocity dispersion (right column) fields of NGC 4330. The simulated Hα velocity and velocity dispersion fields are given down to the faintest levels used in the middle panel of Fig. C.8 to show the kinematical properties of the low column density ionised gas reached by the simulations (panels b and e) and at a higher surface brightness level corresponding to the sensitivity of the FP observations (Σ(Hα)≃ 2 × 10⁻¹⁷ erg s−1 cm−2 arcsec−2, panel c). The contours on the velocity fields indicate the Hα surface brightness Σ(Hα)∼ 2×10⁻¹⁸ erg s−1 cm−2 arcsec−2 taken from the VESTIGE data (Fossati et al. 2018).
Current usage metrics show cumulative count of Article Views (full-text article views including HTML views, PDF and ePub downloads, according to the available data) and Abstracts Views on Vision4Press platform.
Data correspond to usage on the plateform after 2015. The current usage metrics is available 48-96 hours after online publication and is updated daily on week days.
Initial download of the metrics may take a while.