Fig. 9.
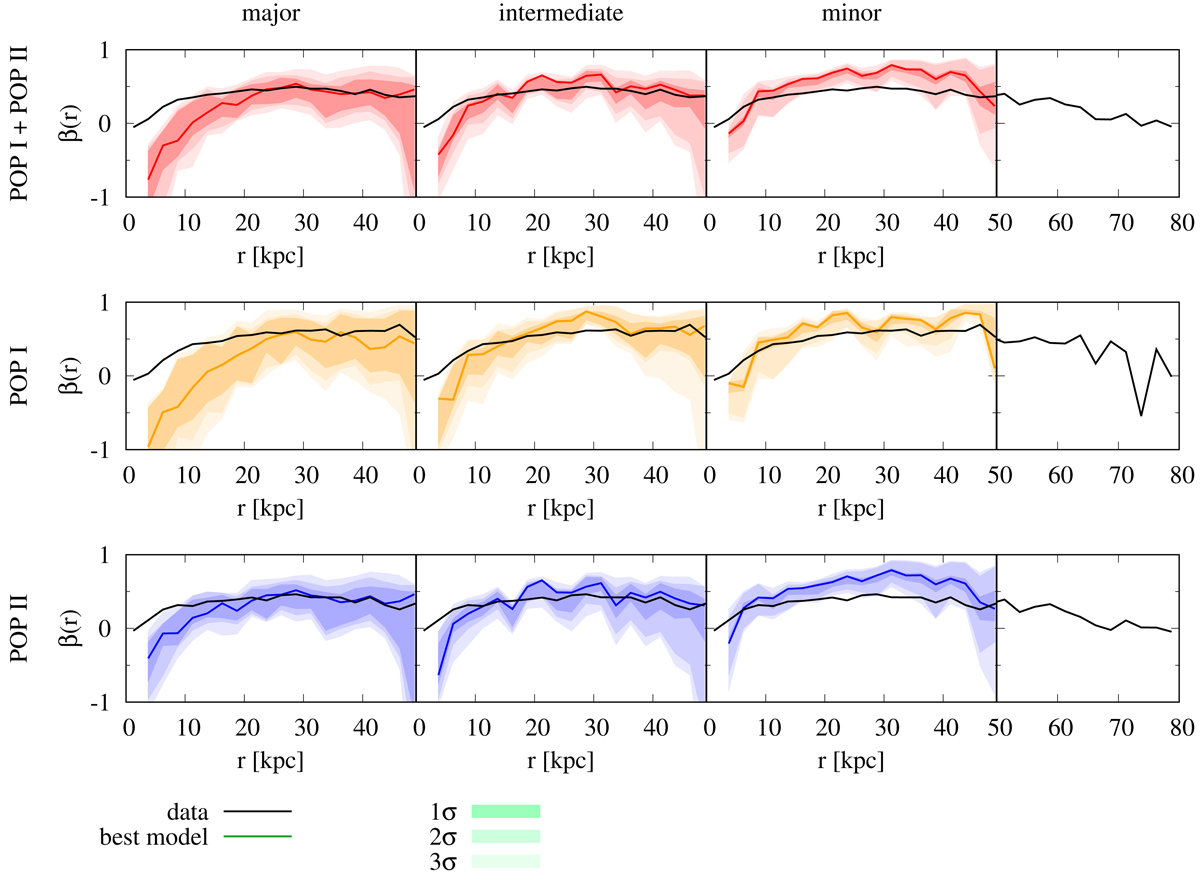
Download original image
Profiles of the anisotropy parameter obtained with the Schwarzschild modeling of two stellar populations of the simulated galaxy. In rows: results for all stars (calculated as the superposition of two populations), population I, and population II. Colors follow the convention used in previous figures. In columns: observations along the major, intermediate, and minor axis. The last narrower column shows the data (black lines) outside the modeled radial range. Color lines indicate values for the best-fit models whereas the colored areas of decreasing intensity show the 1, 2, and 3σ confidence regions.
Current usage metrics show cumulative count of Article Views (full-text article views including HTML views, PDF and ePub downloads, according to the available data) and Abstracts Views on Vision4Press platform.
Data correspond to usage on the plateform after 2015. The current usage metrics is available 48-96 hours after online publication and is updated daily on week days.
Initial download of the metrics may take a while.