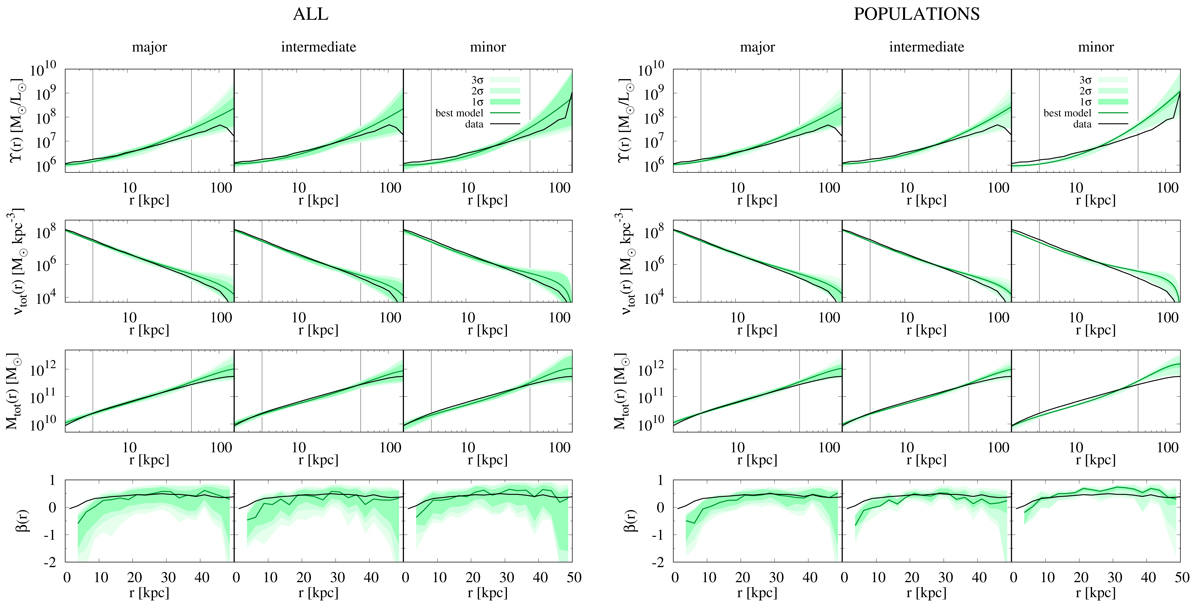
Fig. 8.
Download original image
Left-hand side: results of Schwarzschild modeling of three mock data sets obtained by observing the simulated galaxy along the principal axes. In rows: derived mass-to-light ratio, total density, total mass, and anisotropy parameter. In columns: observations along the major, intermediate, and minor axis, respectively. Green lines indicate values for the best-fit models whereas the colored areas of decreasing intensity show the 1, 2, and 3σ confidence levels. The true values are presented as black lines. Thin vertical lines mark the values of r0 and the outer range of the data sets, from left to right. Right-hand side: same as left but for the fit of two stellar populations.
Current usage metrics show cumulative count of Article Views (full-text article views including HTML views, PDF and ePub downloads, according to the available data) and Abstracts Views on Vision4Press platform.
Data correspond to usage on the plateform after 2015. The current usage metrics is available 48-96 hours after online publication and is updated daily on week days.
Initial download of the metrics may take a while.