Fig. 7.
Download original image
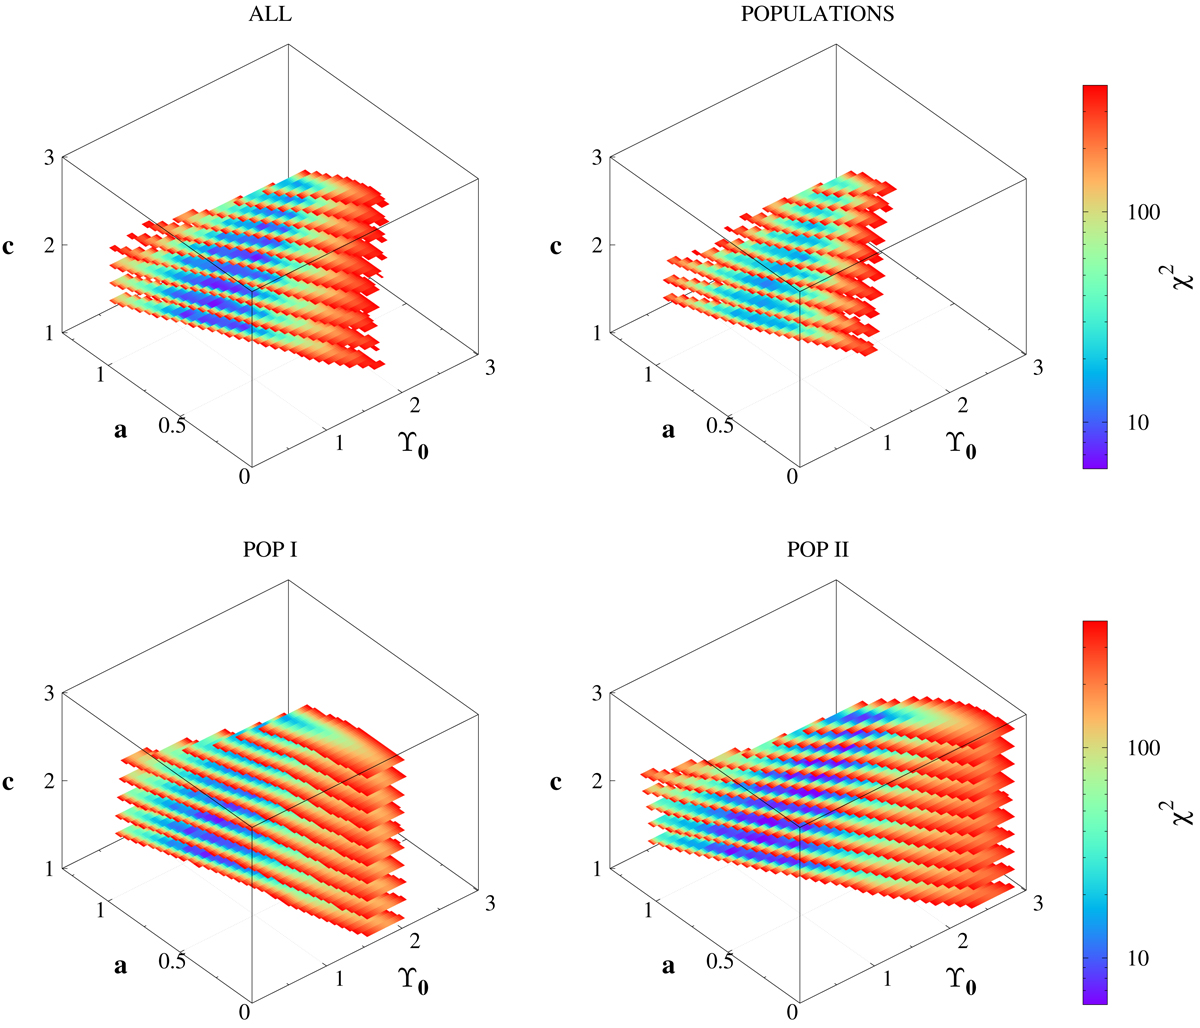
Absolute values of χ2 obtained from the fits of three data sets: all stars (top left panel), population I (bottom left), and population II (bottom right) for the observations along the major axis of the simulated galaxy. The results for the modeling of two populations (top right) were obtained as an algebraic sum of values for populations I and II. To avoid large numbers in the figure, Υ0 was divided by the mean mass of a stellar particle.
Current usage metrics show cumulative count of Article Views (full-text article views including HTML views, PDF and ePub downloads, according to the available data) and Abstracts Views on Vision4Press platform.
Data correspond to usage on the plateform after 2015. The current usage metrics is available 48-96 hours after online publication and is updated daily on week days.
Initial download of the metrics may take a while.