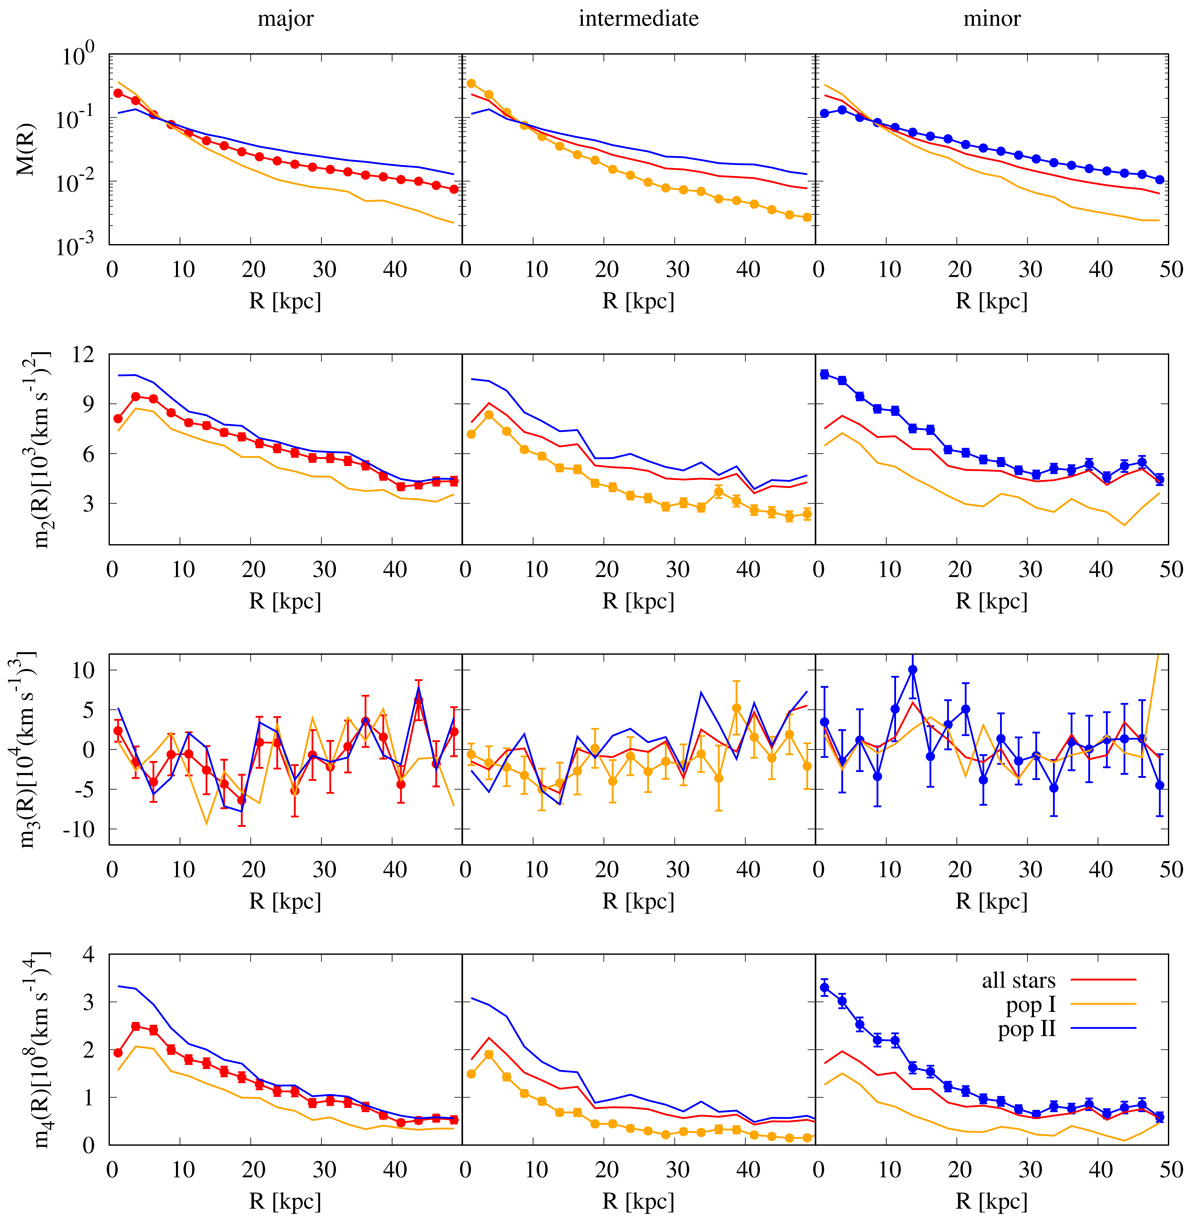
Fig. 6.
Download original image
Observables used in our Schwarzschild modeling scheme of the simulated galaxy. In rows: the fraction of the total number of stars, 2nd, 3rd, and 4th velocity moment. In columns: mock data from the simulated galaxy along the major, intermediate, and minor axis. In red we present the values obtained for all stars whereas in orange and blue those for populations I and II, respectively. For clarity of the figure, in each panel we indicate only the error bars for one of the data sets.
Current usage metrics show cumulative count of Article Views (full-text article views including HTML views, PDF and ePub downloads, according to the available data) and Abstracts Views on Vision4Press platform.
Data correspond to usage on the plateform after 2015. The current usage metrics is available 48-96 hours after online publication and is updated daily on week days.
Initial download of the metrics may take a while.