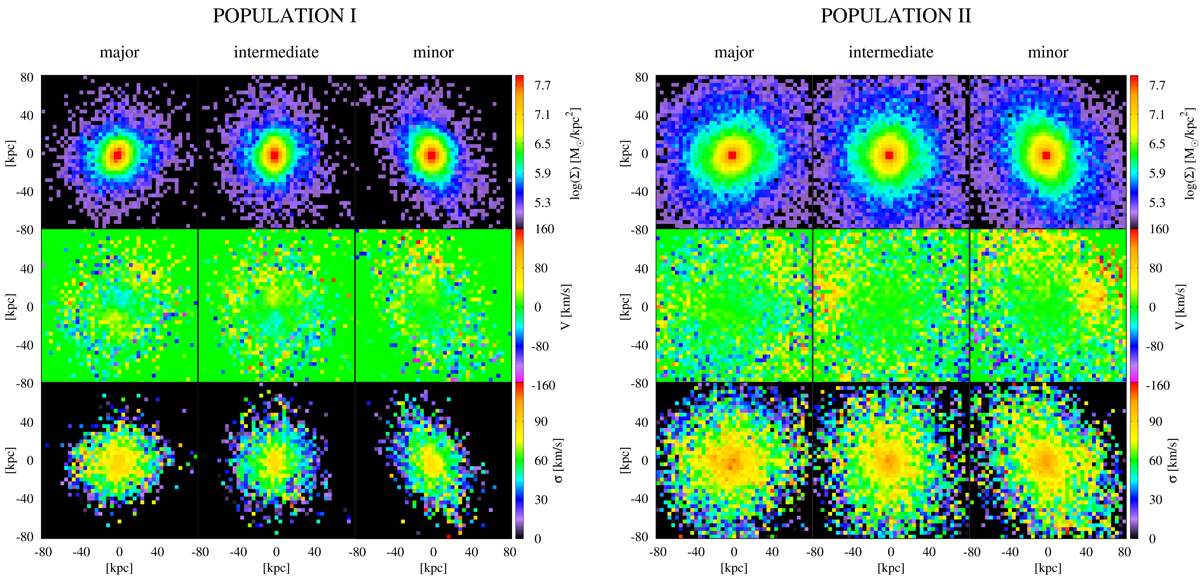
Fig. 3.
Download original image
Maps of the projected stellar density, mean stellar velocity, and stellar velocity dispersion (in rows) for two stellar populations: the metal-rich population I (left-hand side panels) and the metal-poor population II (right-hand side), and observations along the principal axes determined for all stars (in columns, along the major, the intermediate, and the minor axis, respectively).
Current usage metrics show cumulative count of Article Views (full-text article views including HTML views, PDF and ePub downloads, according to the available data) and Abstracts Views on Vision4Press platform.
Data correspond to usage on the plateform after 2015. The current usage metrics is available 48-96 hours after online publication and is updated daily on week days.
Initial download of the metrics may take a while.