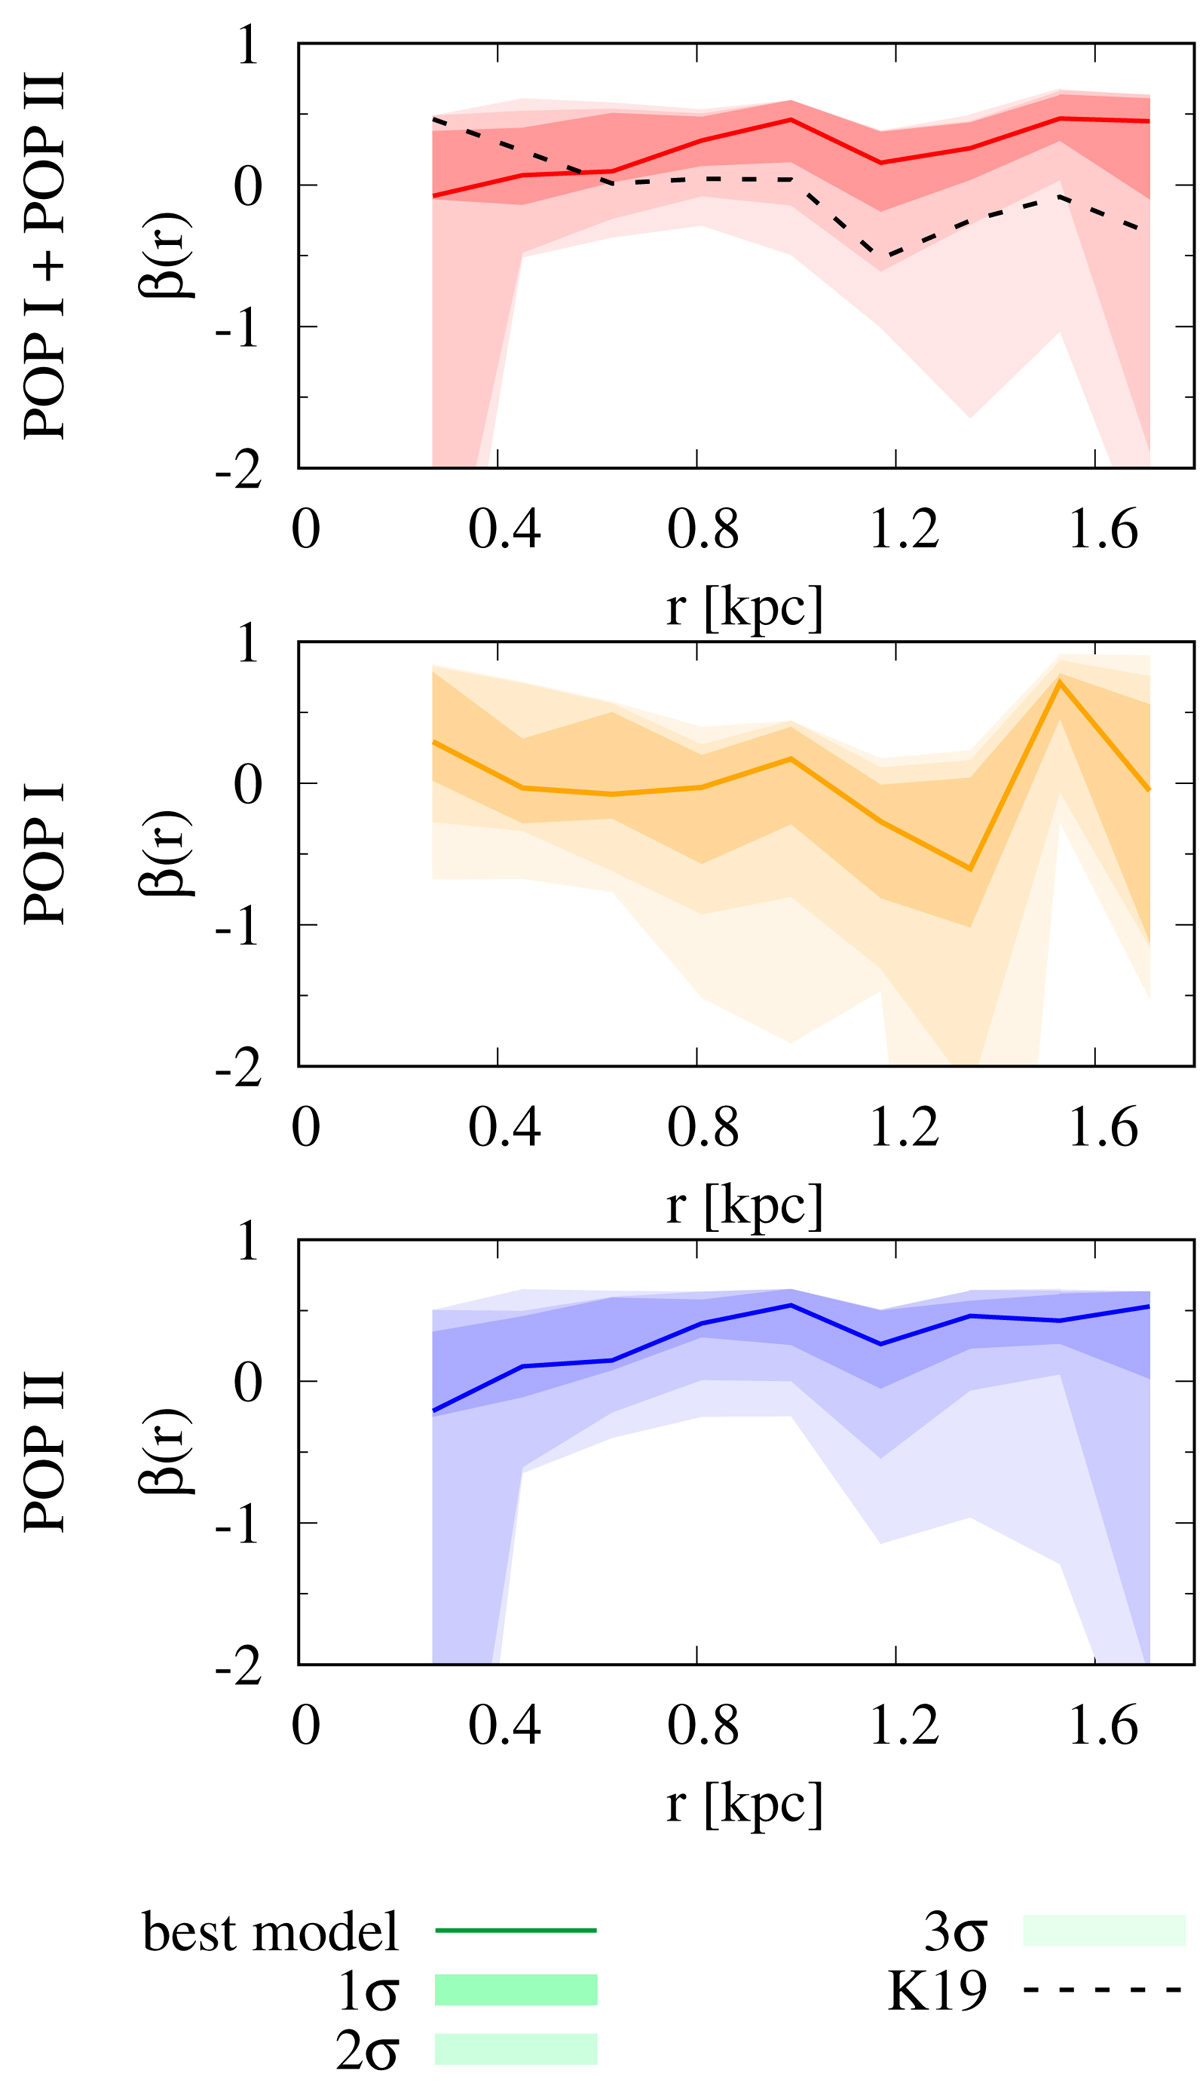
Fig. 15.
Download original image
Profiles of the anisotropy parameter obtained with the Schwarzschild modeling of two stellar populations for the Fornax dSph. In rows: results for all stars (calculated as the superposition of two populations), population I, and population II. Color lines indicate values for the best-fit models whereas the colored areas of decreasing intensity show the 1, 2, and 3σ confidence regions. The dashed black line shows the result from Kowalczyk et al. (2019) for comparison.
Current usage metrics show cumulative count of Article Views (full-text article views including HTML views, PDF and ePub downloads, according to the available data) and Abstracts Views on Vision4Press platform.
Data correspond to usage on the plateform after 2015. The current usage metrics is available 48-96 hours after online publication and is updated daily on week days.
Initial download of the metrics may take a while.