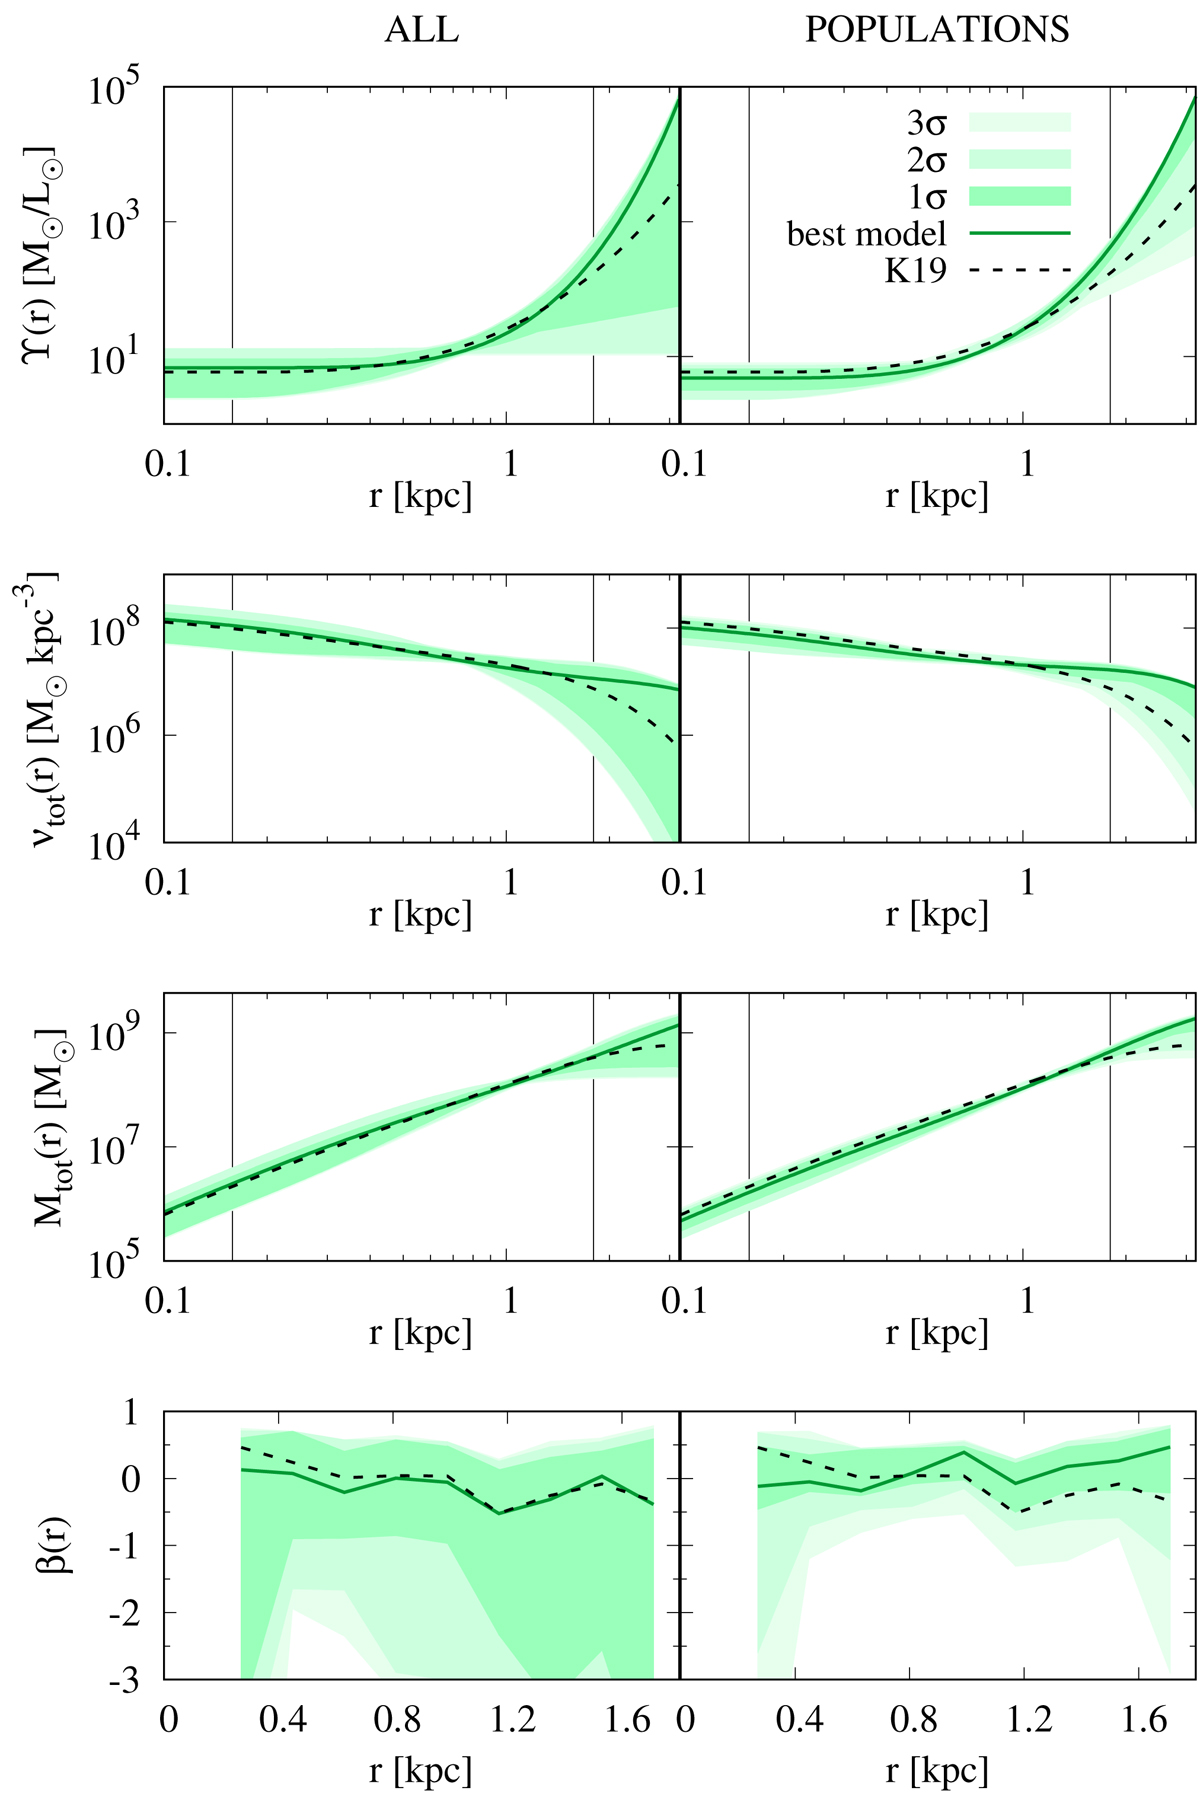
Fig. 14.
Download original image
Results of Schwarzschild modeling of the Fornax dSph. In rows: derived mass-to-light ratio, total density, total mass, and anisotropy parameter. In columns: results for all stars and the populations, respectively. Green lines indicate the values for the best-fit models whereas the colored areas of decreasing intensity show the 1, 2, and 3σ confidence regions. The best-fitting values obtained by Kowalczyk et al. (2019) are shown with black dashed lines.
Current usage metrics show cumulative count of Article Views (full-text article views including HTML views, PDF and ePub downloads, according to the available data) and Abstracts Views on Vision4Press platform.
Data correspond to usage on the plateform after 2015. The current usage metrics is available 48-96 hours after online publication and is updated daily on week days.
Initial download of the metrics may take a while.