Fig. 3.
Download original image
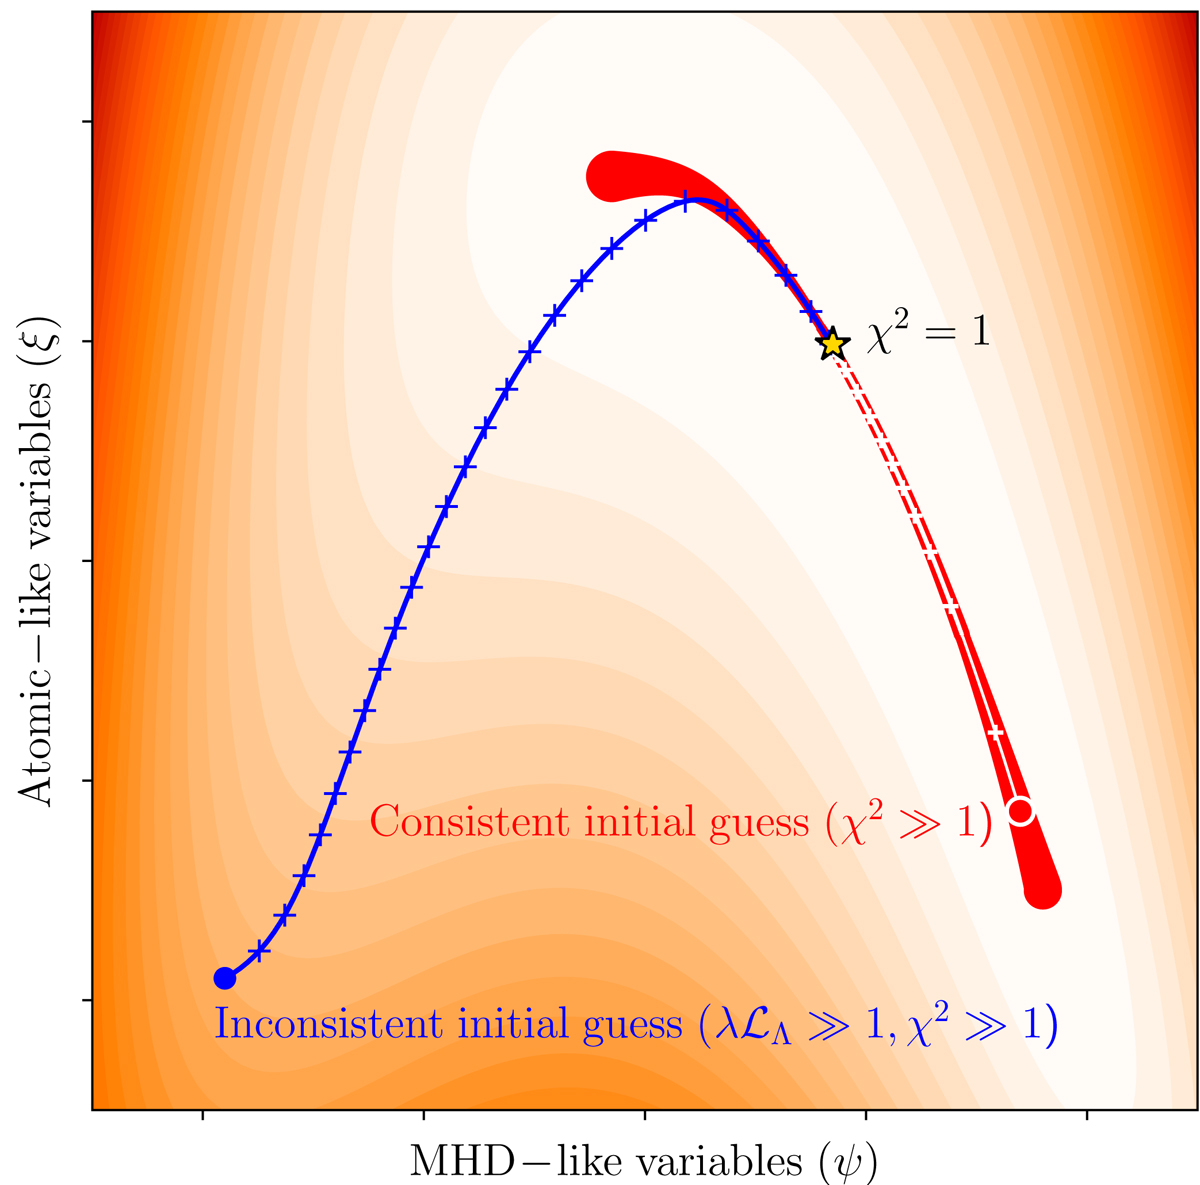
Schematic visualization of the inversion process in the space spanned by the MHD-like and atomic-like variables. The background color indicates deviation from the NLTE consistency, ℒΛ, for every combination of the MHD- and atomic-like variables, with the brightest color representing the minimum value. The red line shows the common approach to the NLTE inversion as a sequence of physically consistent NLTE models of decreasing χ2 value (constrained minimization). The blue line shows an unconstrained minimization with allowed inconsistent solutions during the inversion process.
Current usage metrics show cumulative count of Article Views (full-text article views including HTML views, PDF and ePub downloads, according to the available data) and Abstracts Views on Vision4Press platform.
Data correspond to usage on the plateform after 2015. The current usage metrics is available 48-96 hours after online publication and is updated daily on week days.
Initial download of the metrics may take a while.